
Where is the market heading in the next two weeks? When will the next cascade arrive? And what trading opportunities exist before it does?
I. Reaffirming the Thesis
The relative quiet following the October 11 market catastrophe is not a signal of recovery. It is a period of strategic repositioning and liquidity engineering. The market has not healed; it is being systematically prepared for its next major directional move. This report is a direct continuation of our October 12 analysis, "The Cascade: An Autopsy of the Oct. 11 Crash and a Navigational Framework for What's Next," and is intended to demonstrate how the current price action is a logical, predictable phase within the overarching bearish structure we previously identified.
Our foundational thesis from "The Cascade" remains unchanged and has, in fact, been validated by the post-crash price action. We reiterate: the market is in a structural, long-term distribution phase. The recent ~$20 billion leverage-flush was not the end of the story; it was merely the end of a chapter. Any subsequent strength must be viewed as a component of a larger distribution campaign, not the beginning of a new accumulation cycle.
This report introduces our forward-looking thesis: the market phase of the next two weeks—a slow, grinding descending channel—is a designed environment intended to achieve two critical goals for large-scale market operators:
To psychologically exhaust and systematically stop-loss the remaining weak-willed longs, while hunters establish low-cost long positions.
To build up a liquidity pool of "chase-short" traders who will, in turn, be hunted.
The climax of this phase will be a final, sharp, and deceptive rally—a liquidity hunt—designed to liquidate these shorts before the true, violent downward continuation begins, which targets the area below the $100,000 psychological level.
II. Validating Our Bearish Framework
A Review of the "Perfectly Executed" Crash
To build a precise read on the current market, we must first revisit the core thesis of "The Cascade". This is not a historical review; it is a validation of our predictive model’s efficacy. The textbook Wyckoff UTAD (Upthrust After Distribution), the "long-on-long" liquidation cascade fueled by extreme leverage, and the internal contagion accelerated by the USDe de-peg—these were not random events. They were the inevitable outcome of a fragile market structure. This proven analytical framework is the only valid lens through which to interpret the current market.
Post-Crash Behavior as Confirmation
The market action since October 11 has provided an unmistakable confirmation of our bearish thesis. An analysis of the anemic nature of the bounces, the failure to reclaim key breakdown levels, and the shrinking volume on rallies reveals one critical fact : This is the signature of a market where the dominant force has finished its primary distribution and is now merely managing the subsequent decline, not seeking to re-accumulate.
This crash must be understood not as a terminal event, but as the causal event for the current market structure. It reshaped the battlefield on two levels. First, the violent removal of ~$20 billion in leverage has exhausted the market's speculative fuel, making a strong V-shaped recovery structurally impossible. Second, the sharp swing in sentiment from "Greed" (Index 64) to "Fear" (Index 27) has purged the "tourist" capital. The current, slow-grinding price action is therefore not a sign of strength or base-building. It is the natural state of a post-bubble, deleveraged market where organic demand is weak and "smart money" is either passive or continuing to distribute. This directly validates our strategic outlook from "The Cascade": the simple "Buy The Dip" strategy is not just ineffective, it has become "extremely dangerous".
III. Anatomy of the Descending Channel
Technical Analysis
(Due to the highly profitable nature of the following content, which carries influence and value on par with our Bitcoin top-short report, this section is available to paid subscribers only ).
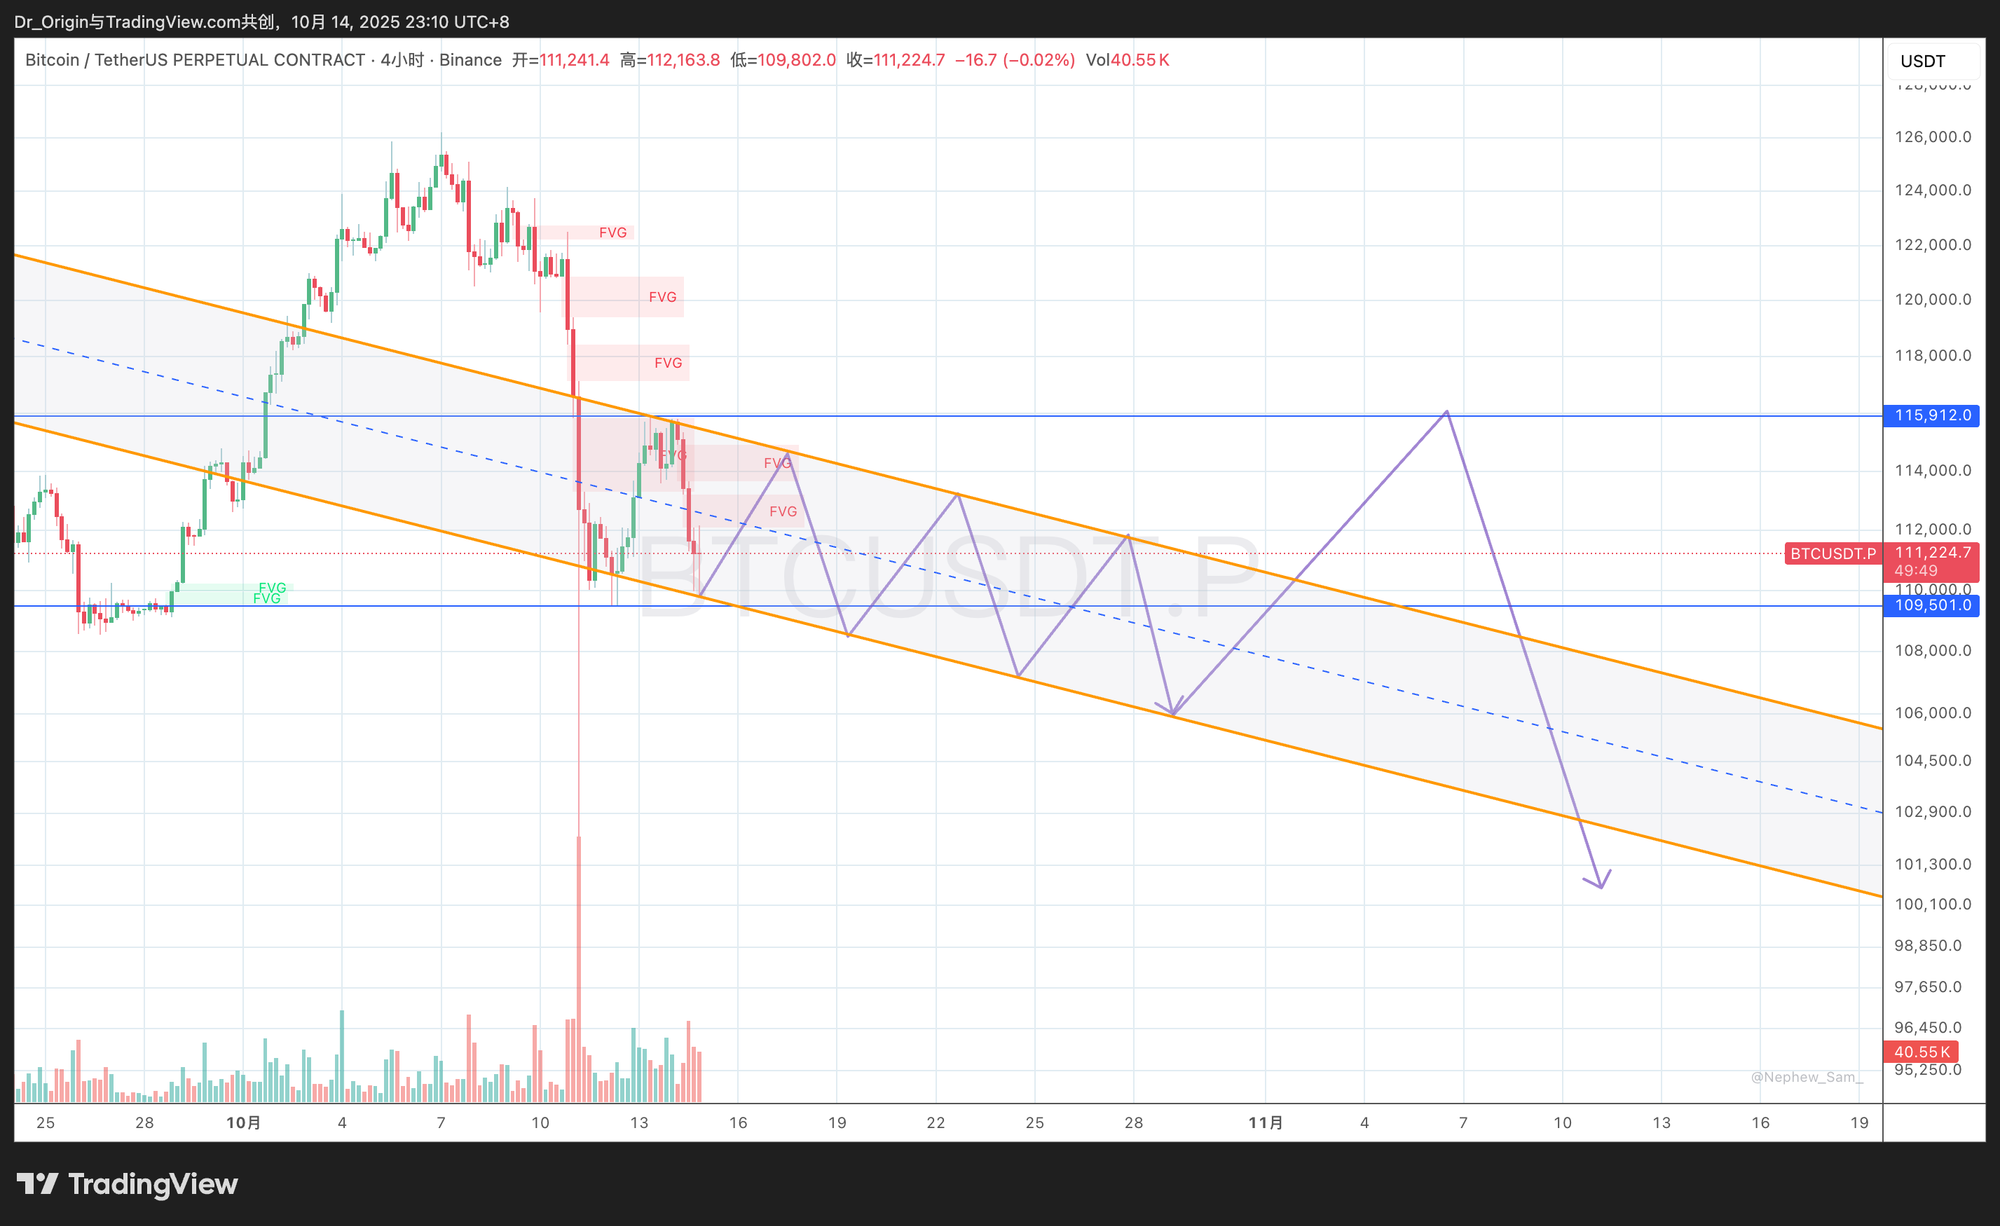
As illustrated in the chart, our extensive trading and market-making experience allows us to anticipate a meticulously constructed descending channel. This channel is defined by a clear series of lower highs and lower lows, providing a predictable framework. During this decline, price has left multiple Fair Value Gaps (FVGs) at key locations—areas representing imbalance and liquidity vacuums. The channel's midline acts as a dynamic control point, with price oscillating around it, showing a temporary—and deceptive—equilibrium.
The Mechanism of Psychological Warfare
This slow, grinding channel is a "death by a thousand cuts" psychological strategy. We can see that "longs are being repeatedly stopped out" within this channel. Unlike a sharp crash that offers a clear point of capitulation, this slow bleed is designed to erode the capital and conviction of "buy-the-dip" participants, forcing their eventual surrender through attrition. Simultaneously, this predictable environment induces retail traders to begin building short positions, placing their stop-loss orders just above the channel's resistance line. This process systematically and incrementally builds a massive pool of short positions ("shorts gradually accumulating"), sowing the seeds for the next phase of manipulation.
Derivatives & On-Chain Evidence
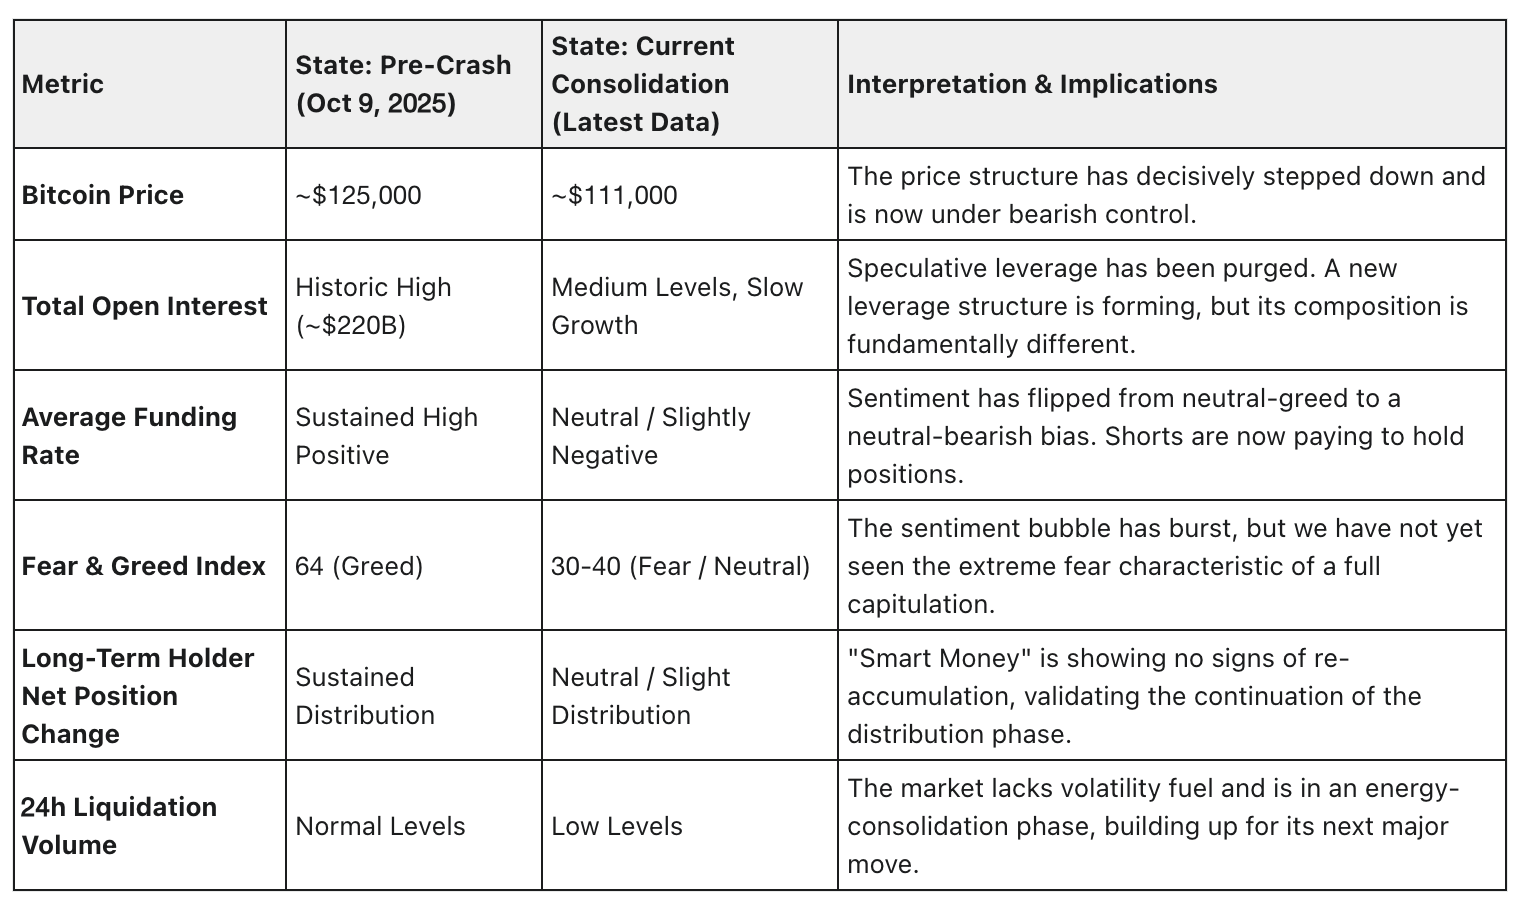
Derivatives data provides quantitative support for this psychological narrative. During this consolidation, we are observing Open Interest (OI) slowly rebuilding. However, unlike the pre-crash environment, Funding Rates are persistently neutral to slightly negative. This indicates that the new leverage is not from aggressive longs, but is driven primarily by participants establishing short positions. This is a perfect confirmation of the "shorts gradually accumulating" thesis, as the market shifts from one extreme leverage imbalance to the other.
The following table provides a quantitative comparison, clearly illustrating the market's structural shift. This data supports our core thesis: the current environment is a preparatory stage for the next major directional move, not a recovery.
This descending channel is not just a technical pattern; it is a "liquidity farm". Its clear, predictable boundaries systematically "train" market participants, making their reactive behaviors (like stop-loss placement) highly predictable—and therefore, highly exploitable. Market makers need liquidity to execute large orders without significant slippage. This channel encourages traders to short near the top, placing their buy-stop orders. just above the declining trendline. Over time, a large, concentrated pool of these stops—the "harvest"—accumulates. This pool of buy-side liquidity is precisely what a large entity looking to sell (distribute) a large position needs. This grinding process is therefore a necessary preparatory step for the final manipulative rally we forecast. It is not a random walk, but a phase with a clear economic purpose.
IV. The Final Deception: Engineering Exit Liquidity
The Dual-Purpose Liquidity Hunt

The predicted upward spike on the chart (indicated by the purple arrow) is not a genuine recovery attempt. It is a precisely calculated manipulation designed to achieve two goals simultaneously:
- Stop Liquidation: To trigger the clusters of buy-stop orders from shorts that have accumulated above the channel. These passive buy orders provide deep, concentrated liquidity for large sellers to complete their distribution without crashing the market.
- Inducement: To create the illusion of a bullish breakout, luring in FOMO-driven breakout buyers. These "chase" buyers represent the final wave of "exit liquidity" that smart money needs to sell their positions at a high price.
Wyckoff Correlation (Continuity)
This manipulation is a fractal echo of the large-scale UTAD (Upthrust After Distribution) we identified in our original short report. We can classify this smaller spike as a "secondary test" of supply in a weak position, or a final "Shakeout" within the new distribution range. This direct link demonstrates the self-similar, repeatable nature of market manipulation and the enduring power of our analytical framework.
This forecasted move exploits asymmetries in information and execution. Operators can deduce the precise locations of stop-loss clusters by analyzing the order book and market microstructure. They possess the capital to initiate a rapid price push, which becomes self-fulfilling as the first stops are triggered, leading to a domino effect. Simultaneously, algorithms and manual traders, seeing the price break resistance, pile in, further exacerbating the buying pressure. At the peak of this manufactured buying frenzy, the operators execute their massive sell orders, absorbing all the buy-side liquidity they just engineered. Once their selling is complete, the artificial buying pressure vanishes, and the price collapses under its own weight, trapping both the stopped-out shorts and the induced longs. This is the mechanism behind the subsequent "drop directly below $100k".
V. Execution and Risk Management
Optimal Short Entry
The highest probability, best risk/reward entry for new or additional short positions is not within the current grinding channel. The optimal entry zone lies at the apex of the forecasted liquidity hunt. Based on our predictive chart and key FVG locations, we are targeting the $115,000 - $116,000 range as the primary new shorting area.
Consolidation Trading
For experienced traders, range-trading the well-defined boundaries of this consolidation (which is expected to last up to half a month) can also be profitable.
Thesis Invalidation Criteria
The strength of a thesis lies in its clear invalidation criteria. The current bearish thesis will be invalidated if, and only if: the price pushes above the liquidity hunt's apex (e.g., above $116,000) and subsequently succeeds in consolidating above that level, turning prior resistance into support. This would indicate the move was one of genuine absorption, not a manipulative trap.
Risk Management
We must reiterate our warning: "any amount of leverage can cause you to lose all your capital, we do not recommend users use more than 3x leverage". Professional-grade execution discipline is paramount.
VI. Conviction Amid Complexity
The path of least resistance—and maximum pain—is down. The market is not recovering; it is reloading. The current consolidation is a feature, not a bug—it is the necessary interlude to engineer the liquidity required for the next major cascade. Our analysis indicates this cascade will be triggered by one final, deceptive bull trap.
As the October 11 crash proved, the era of simple, momentum-driven investing is over. The crypto market has entered "a pro-player's era". In this environment, Alpha is no longer a function of audacity, but of a superior understanding of market structure, liquidity dynamics, and internal protocol risks (like the USDe contagion). Our ability to combine the macro structure with the micro mechanics of liquidity hunting is precisely what provides the decisive edge for our clients. The complex game has begun, and our research is the map.