
I. Core Conclusion: Seven Updates, One Script, One Judgment Line
Our previous report, "Daily UTAD Realized as Projected, But Bitcoin Needs One Final Breath," concluded with a single sentence: "This rally’s 'final breath' is likely the final door opening into the primary markdown phase." One week later, that door has been pushed to its creaking point at $76,000—the ultimate judgment line for the massive daily AMD (Accumulation-Manipulation-Distribution) structure that has been developing since February 1st.
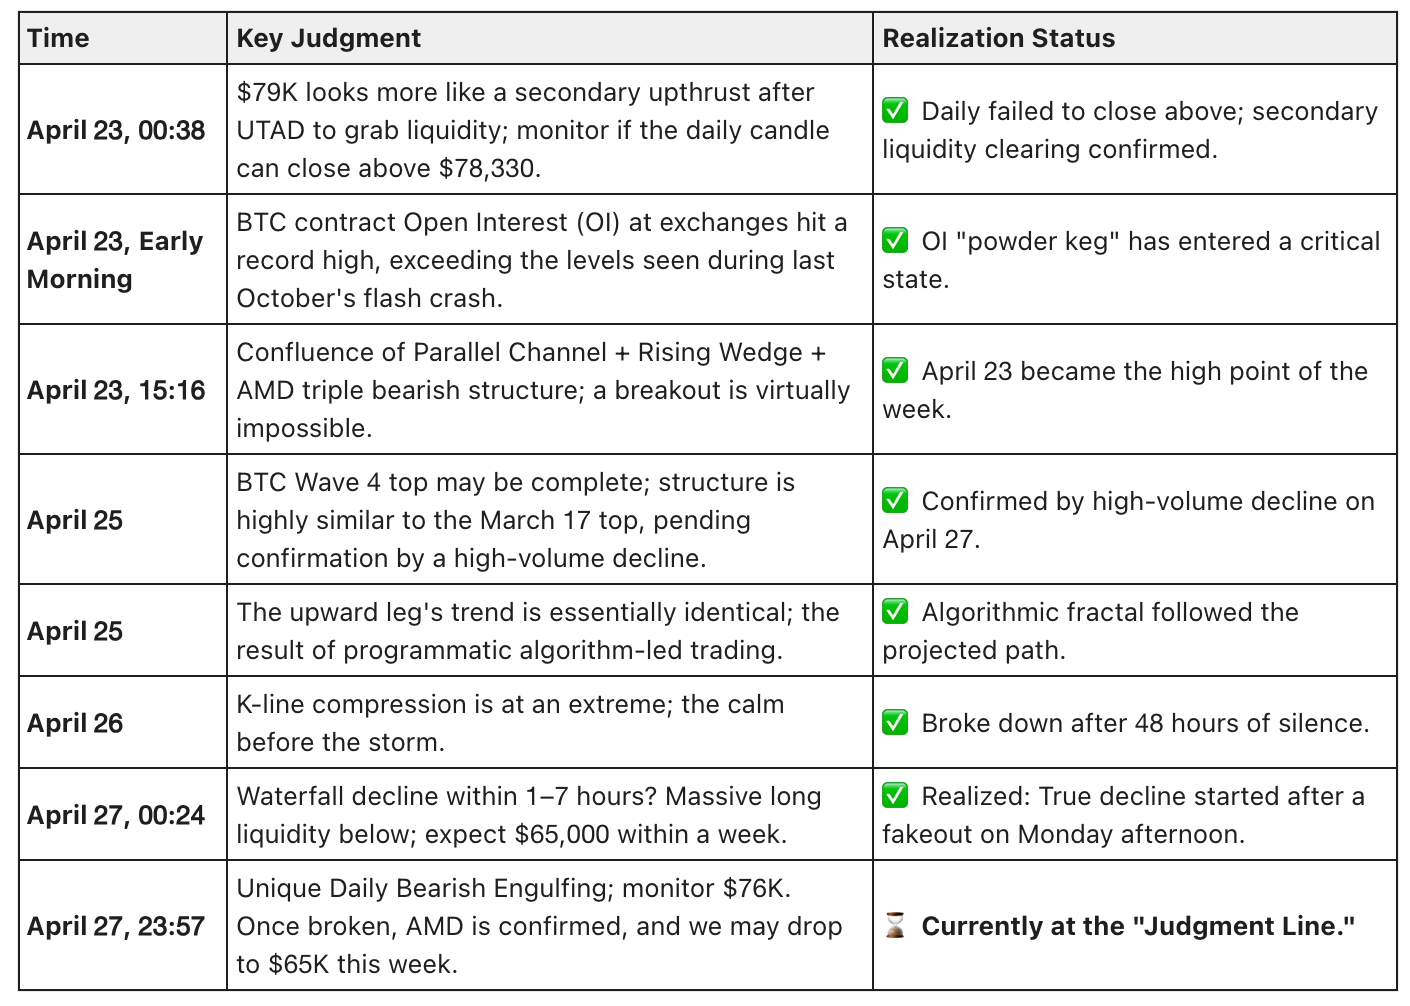
Over the past six days, our sequence of projections shared within the annual membership community has played out as follows:
This is not a retrospective recap; it is a chain of logic validated in real-time under public timestamps. Bitcoin is currently fluctuating around $76,200, just one mid-sized bearish candle away from the critical $76K psychological and technical threshold.
Our core conclusion remains steadfast and is moving into the next phase:
Once the daily candle closes below $76,000, the large-scale daily AMD structure (active since Feb 1) will be finalized. Wave 5 will then enter an accelerated "emotional release" phase, with the potential to strike the $65,000–$67,000 Fair Value Gap (FVG) as early as this week.


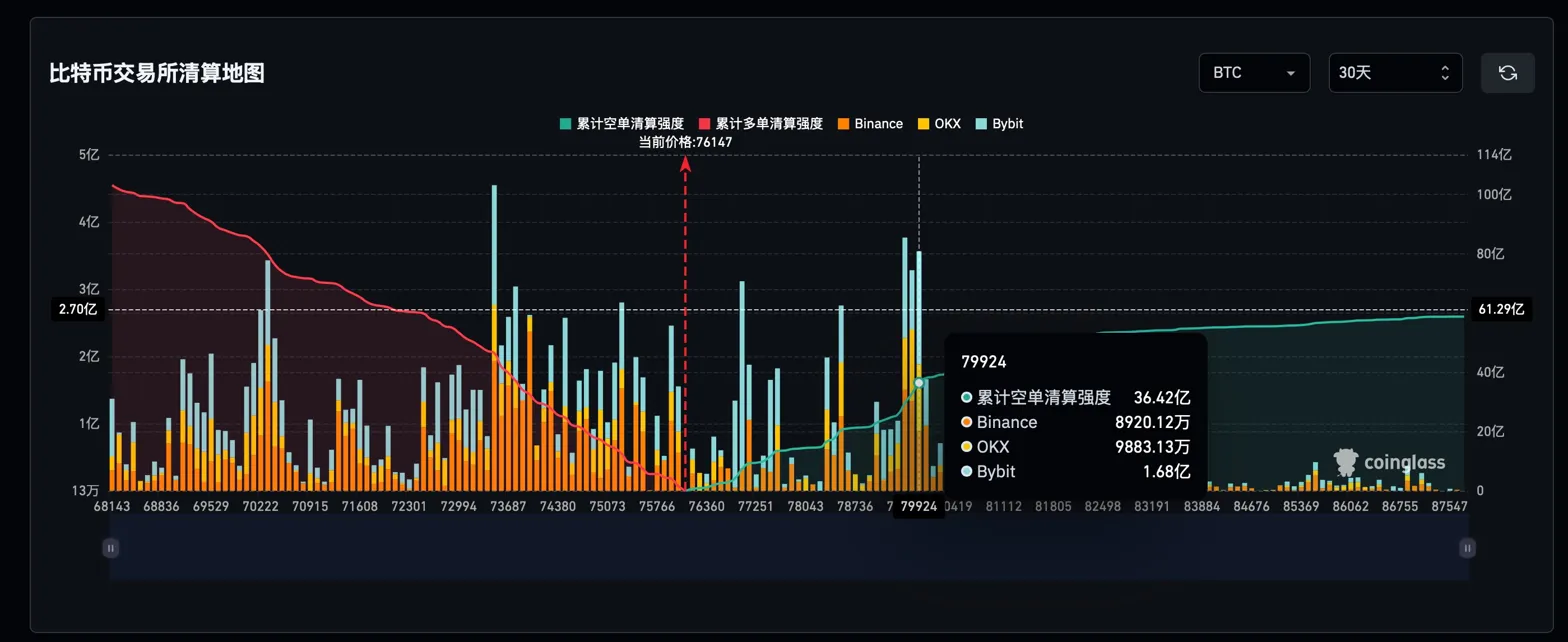
The Sole Caveat: A significant cluster of unabsorbed short-side liquidity remains above $80,000. Liquidation maps indicate a cumulative short liquidation intensity of approximately $3.642 billion at the $79,924 mark. If the initial descent remains too lackluster, we cannot rule out a final, localized "reverse hunt" by major players. This would involve a quick spike above $80K to harvest liquidity before the definitive reversal. We estimate the probability of this scenario at approximately 10%; even if it occurs, it does not alter our directional bias on the daily timeframe.
II. Deep Review: How the Script Progressed to the Judgment Line
2.1 April 23: Double Confirmation of the Secondary UTAD
In the early hours of the 23rd, Bitcoin utilized a $2,656 bullish candle to pierce the previous high of $78,330, reaching $79,385. Social media sentiment flipped instantly from "bear market rally topping out" to "the bull is back." At that moment, we issued our first critical judgment to the community: "From my perspective, this surge—lacking sufficient consolidation or accumulation—is absolutely NOT a signal of a bull market return."
We posed a "judgment test" for our members:
- If the daily candle fails to close above $78,330, it is likely a secondary liquidity sweep following the UTAD.
- If it closes above, observe if the following day’s open and close remain above $78,330; if not, it is still a secondary liquidity sweep.
- If it holds, only then do we consider hedging or reducing short exposure.
The Reality: The daily candle on the 23rd closed at $78,214, missing the $78,330 mark by just a few dozen dollars. No subsequent daily candle has closed above this neckline. This is a textbook "fakeout and reversal" pattern—specifically, a deceptive fakeout with a failed retest, which carries stronger reversal momentum than a simple false breakout.
Simultaneously, our second update noted that BTC contract Open Interest (OI) hit an all-time high, surpassing the levels seen during the $20 billion flash crash on October 11th last year. Absolute coin-margined leverage exposure has reached a historical peak. Combined with the Fed's lack of rate cuts or QE, a breakout from the upper rail of a rising wedge—amidst record OI and short liquidations—is structurally near-impossible.
2.2 April 25–26: The Double Validation of Wave 4 Top and "Algorithmic Fractals"
On April 25, we introduced an exclusive, higher-level perspective: Bitcoin’s current upward leg is an almost identical "fractal" of the mid-March top. Both structures exhibit the same "absorption of bullish momentum" pattern. When overlaying the two segments on a 4-hour chart, the data is staggering:
- Segment 1 (March): 326 candles, 54 days 8 hours, +21.53% gain, $17,355 amplitude.
- Segment 2 (Current): 321 candles, 53 days 12 hours, +26.12% gain, $16,451 amplitude.
This is not mere visual similarity; it is a fractal reproduction driven by programmatic trading algorithms. We projected that if the upward legs match, the downward leg (approx. 45 days) should follow suit, provided the floor gives way by Monday.
2.3 April 27: The 1–7 Hour Prophecy and the Daily Bearish Engulfing
At 00:24 on Monday (27th), we issued the week's most time-sensitive alert: "Waterfall decline within 1–7 hours? Massive long liquidity lies below; once the waterfall begins, expect $65,000 within a week." At that time, the 4H candle was pressing against the lower edge of critical support.
The Execution: On Monday afternoon, Bitcoin initiated the decline via a fakeout. Instead of a direct drop, the market performed a "reverse hunt"—spiking briefly to sweep short stops before the real crash began. This maneuver makes the current decline more lethal, as it cleared out the counter-trend protection (shorts) before hunting the primary targets (longs). By 23:57, a Daily Bearish Engulfing candle was confirmed. Unlike previous instances, this one occurred after a failed breakout of a major high, meaning there is now zero resistance for a downward move.
2.4 Current Tape: 76K is the Ultimate Judgment Line
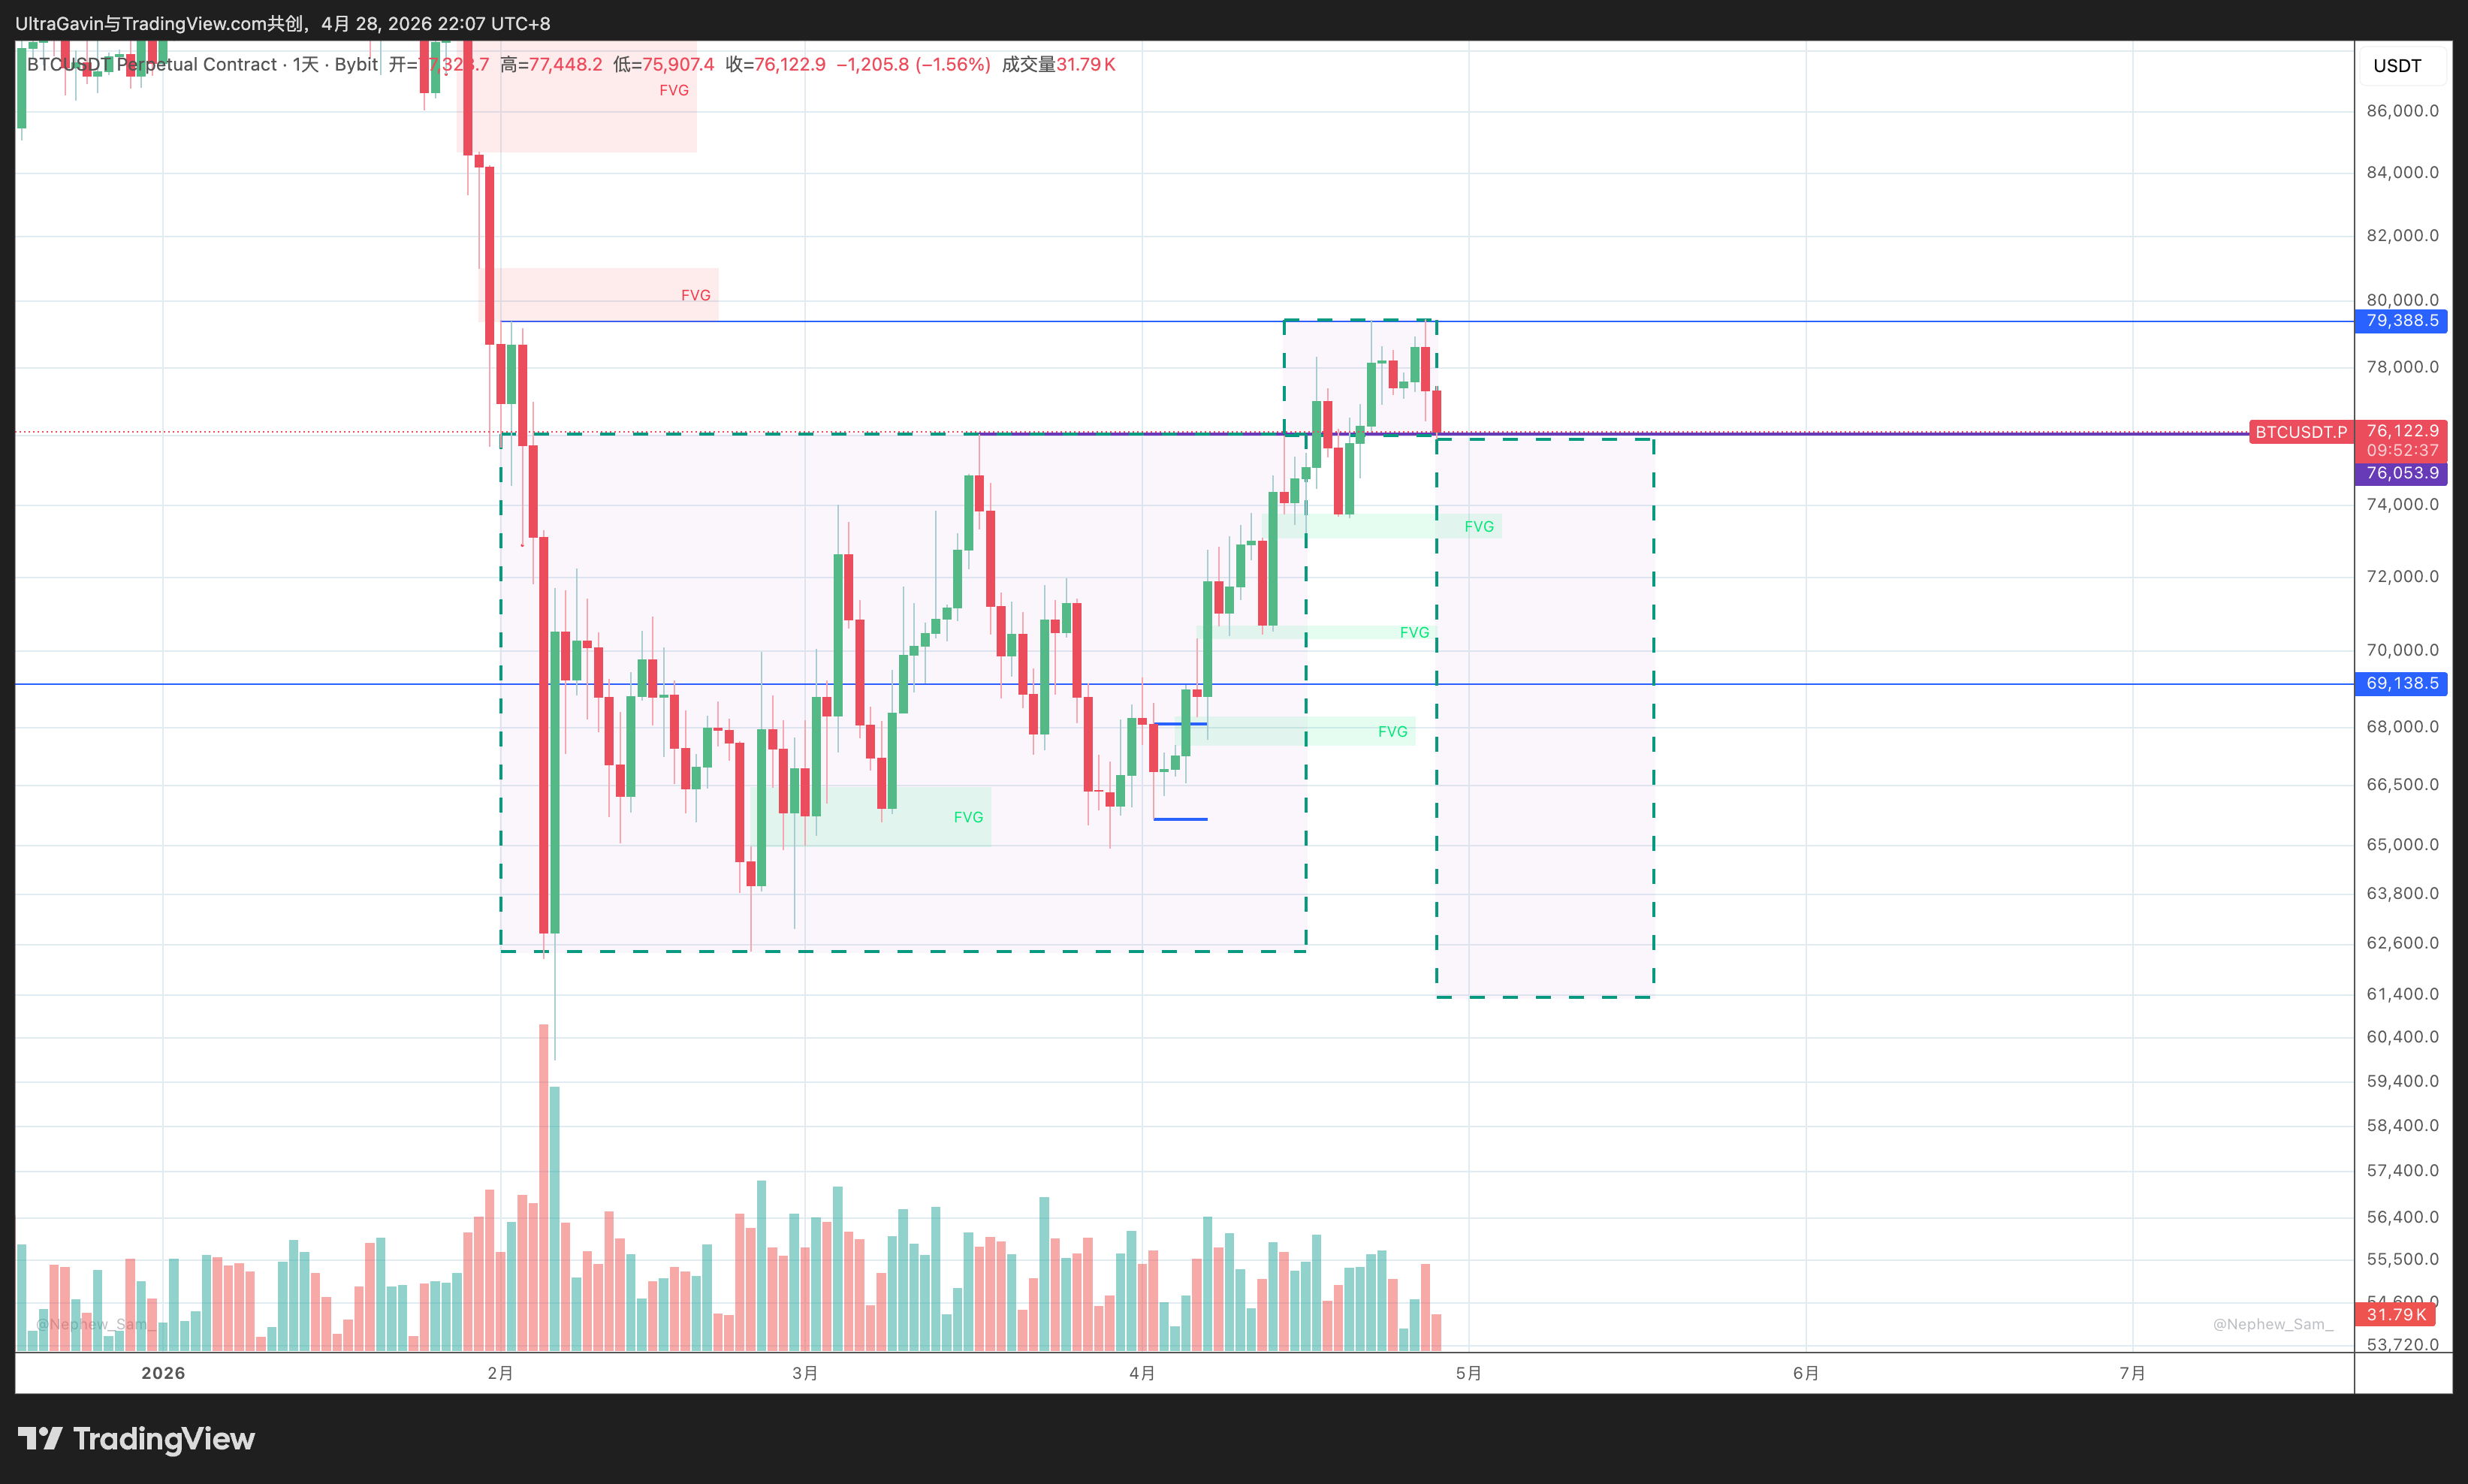
$76,000 is the final line of defense for the M (Manipulation) phase of the large-scale AMD structure active since February 1st. A breach here is not just a technical break; it is the final confirmation of the entire macro structure. In the Wyckoff framework, this marks the official start of the Markdown.
III. Cross-Verification of Liquidity Data
If we examine the Coinglass Liquidation Map, with the current price at $76,147, there is a massive cluster of short liquidations totaling $3.642 billion at the $79,924 mark. This is precisely why we maintain a 10% probability for one final "upward liquidity hunt."
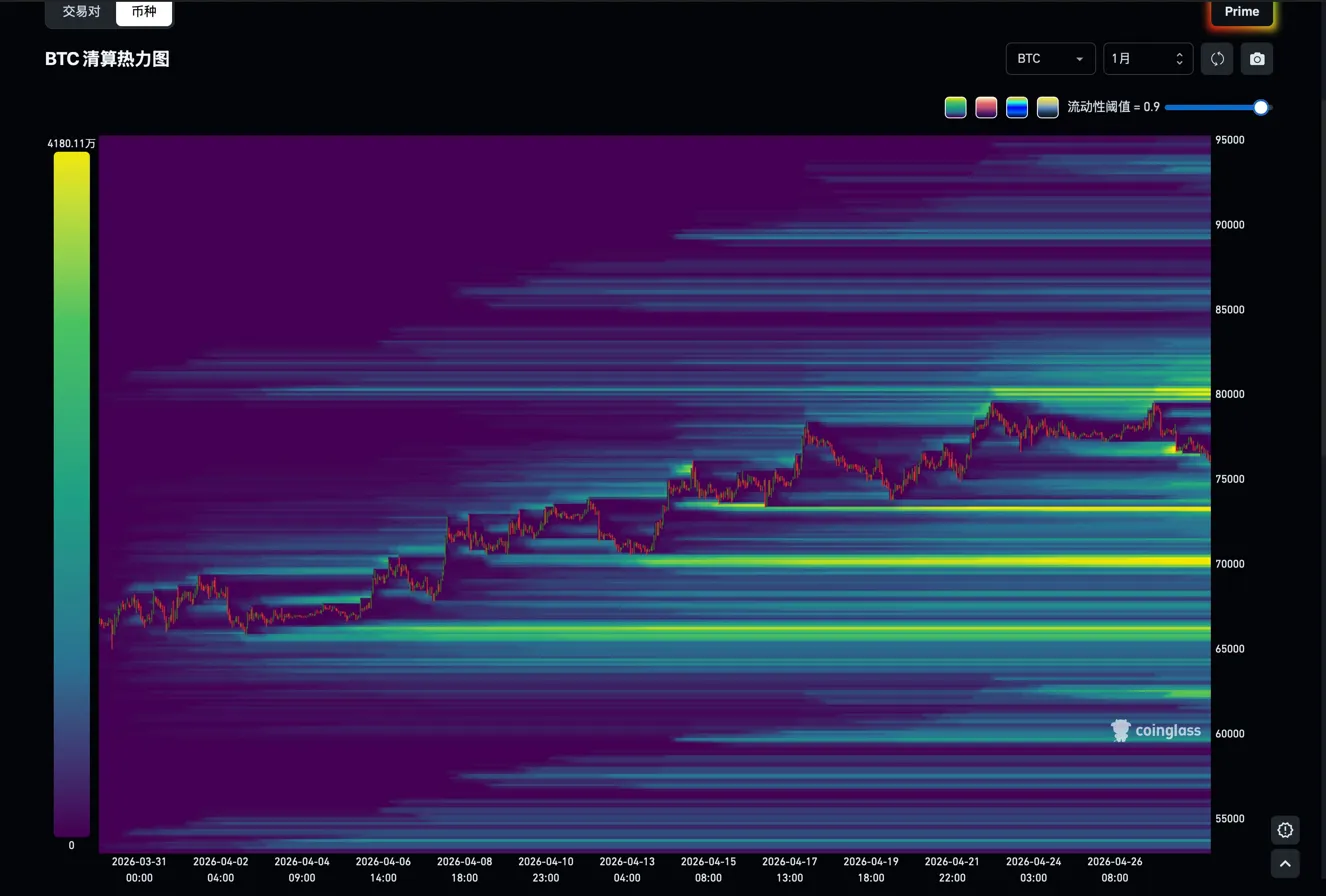
However, looking at the long-term Liquidation Heatmap, the areas around $70,000 and $65,500–$66,000 represent the two brightest yellow liquidity zones accumulated over the past 30 days. These levels are not merely "support"; they are the densest magnets for long-side liquidity in the eyes of market algorithms.
When overlaying these datasets:
- Upside: While the short liquidity near $80,000 is dense, it has formed only within the last 5 trading days. Algorithms typically prioritize long-term accumulated liquidity over "fresh" zones.
- Downside: The dual-layer magnets at $70,000 and $66,000 represent the "unabsorbed zones" of the entire April price action.
- Current State: $76,000 acts as the thinnest barrier between these two magnetic fields.
Once a daily close below $76K is secured, the probability of price being "magnetically sucked" toward $70,000–$66,000 is significantly higher than a retracement to digest the liquidity above $80,000.
At the Macro Level, two additional factors reinforce the bearish bias this week:
- The FOMC Meeting (Wednesday): With the Iran conflict unresolved, Brent crude back above $100, Michigan Consumer Sentiment hitting a historic low of 49.8, and 1-year inflation expectations surging to 4.8%, it is virtually impossible for Powell to deliver a dovish signal.
- ETF Exhaustion: While Spot BTC ETF inflows remain strong (BlackRock’s IBIT totaling $30B), they are no longer sufficient to stabilize the price above $80,000. This is a textbook late-stage distribution signal: absorption exists, but incremental buying power is exhausted.
IV. Priority Action Items for the Next 24–72 Hours
- Monitor the April 29 (Tuesday) Daily Close: This is the Day of Judgment for the large-scale AMD structure. Any daily candle body closing below $76,000 will serve as the final confirmation of the AMD. Once triggered, if you have remaining capacity, consider adding to positions or chasing the breakout on the short side. If a long lower wick appears, wait for a 4-hour close for secondary confirmation.
- Remain Vigilant of the Liquidity Above $80,000, But Maintain Directional Conviction: A low probability is not zero, but it is certainly not 50%. If a "surprise" spike occurs during late-night or weekend hours, view it as an opportunity to add to positions, not to close them.
- Wednesday’s FOMC Meeting: Regardless of whether the decision leans hawkish or dovish, maintain core positions on the day of the meeting. Any impulse rally following the announcement should be treated as an opportunity to add to shorts rather than a reversal signal.
We have waited for two months. Over the past week, the script has played out in its entirety, point by point.
Only the final step remains: the daily close at $76,000. Once this floor gives way, the large-scale daily AMD active since February 1st will be hammered shut, and the Wave 5 "emotional release" waterfall will begin.
At this stage of the trade, the competition is no longer about analytical prowess—it’s about who can remember that this is a structural decline, not a "buy the dip" consolidation, even as everyone else waits for a rebound or a new high. Adhere to the daily framework; ignore the intraday noise. This rally’s final breath is at its throat, and the door to the primary markdown phase is being pushed open before our very eyes.
Disclaimer: The information and views contained in this research report represent the judgment of the Origin Research analytical team and are considered reliable as of this date, but their accuracy or completeness is not guaranteed. Cryptocurrency markets are high-risk investment fields with volatile prices and inherent leverage risks. This report does not constitute direct investment advice, financial advice, or an invitation to trade. Investors should make independent investment decisions based on their own risk tolerance and