
Over the past week, the Bitcoin market has exhibited exceptionally complex and deceptive price action. On the surface, the market has repeatedly tested key resistance levels, with bullish sentiment appearing abnormally high, fueled by social media hype and news of MicroStrategy’s continued accumulation.
However, we must not be blinded by appearances. Our core thesis remains: the current high-level consolidation is not a consolidation for a new directional leg up; rather, it is a sophisticated distribution of shares by institutional capital utilizing complex order-flow strategies. By engineering localized bull traps and hunting existing short positions, the market is completing the confirmation of the Last Point of Supply (LPSY) within the Wyckoffian distribution model. Coupled with the systematic, indiscriminate selling pressure from Bitcoin miners facing cost-revenue inversions, the underlying bearish logic of the current market remains steadfast.
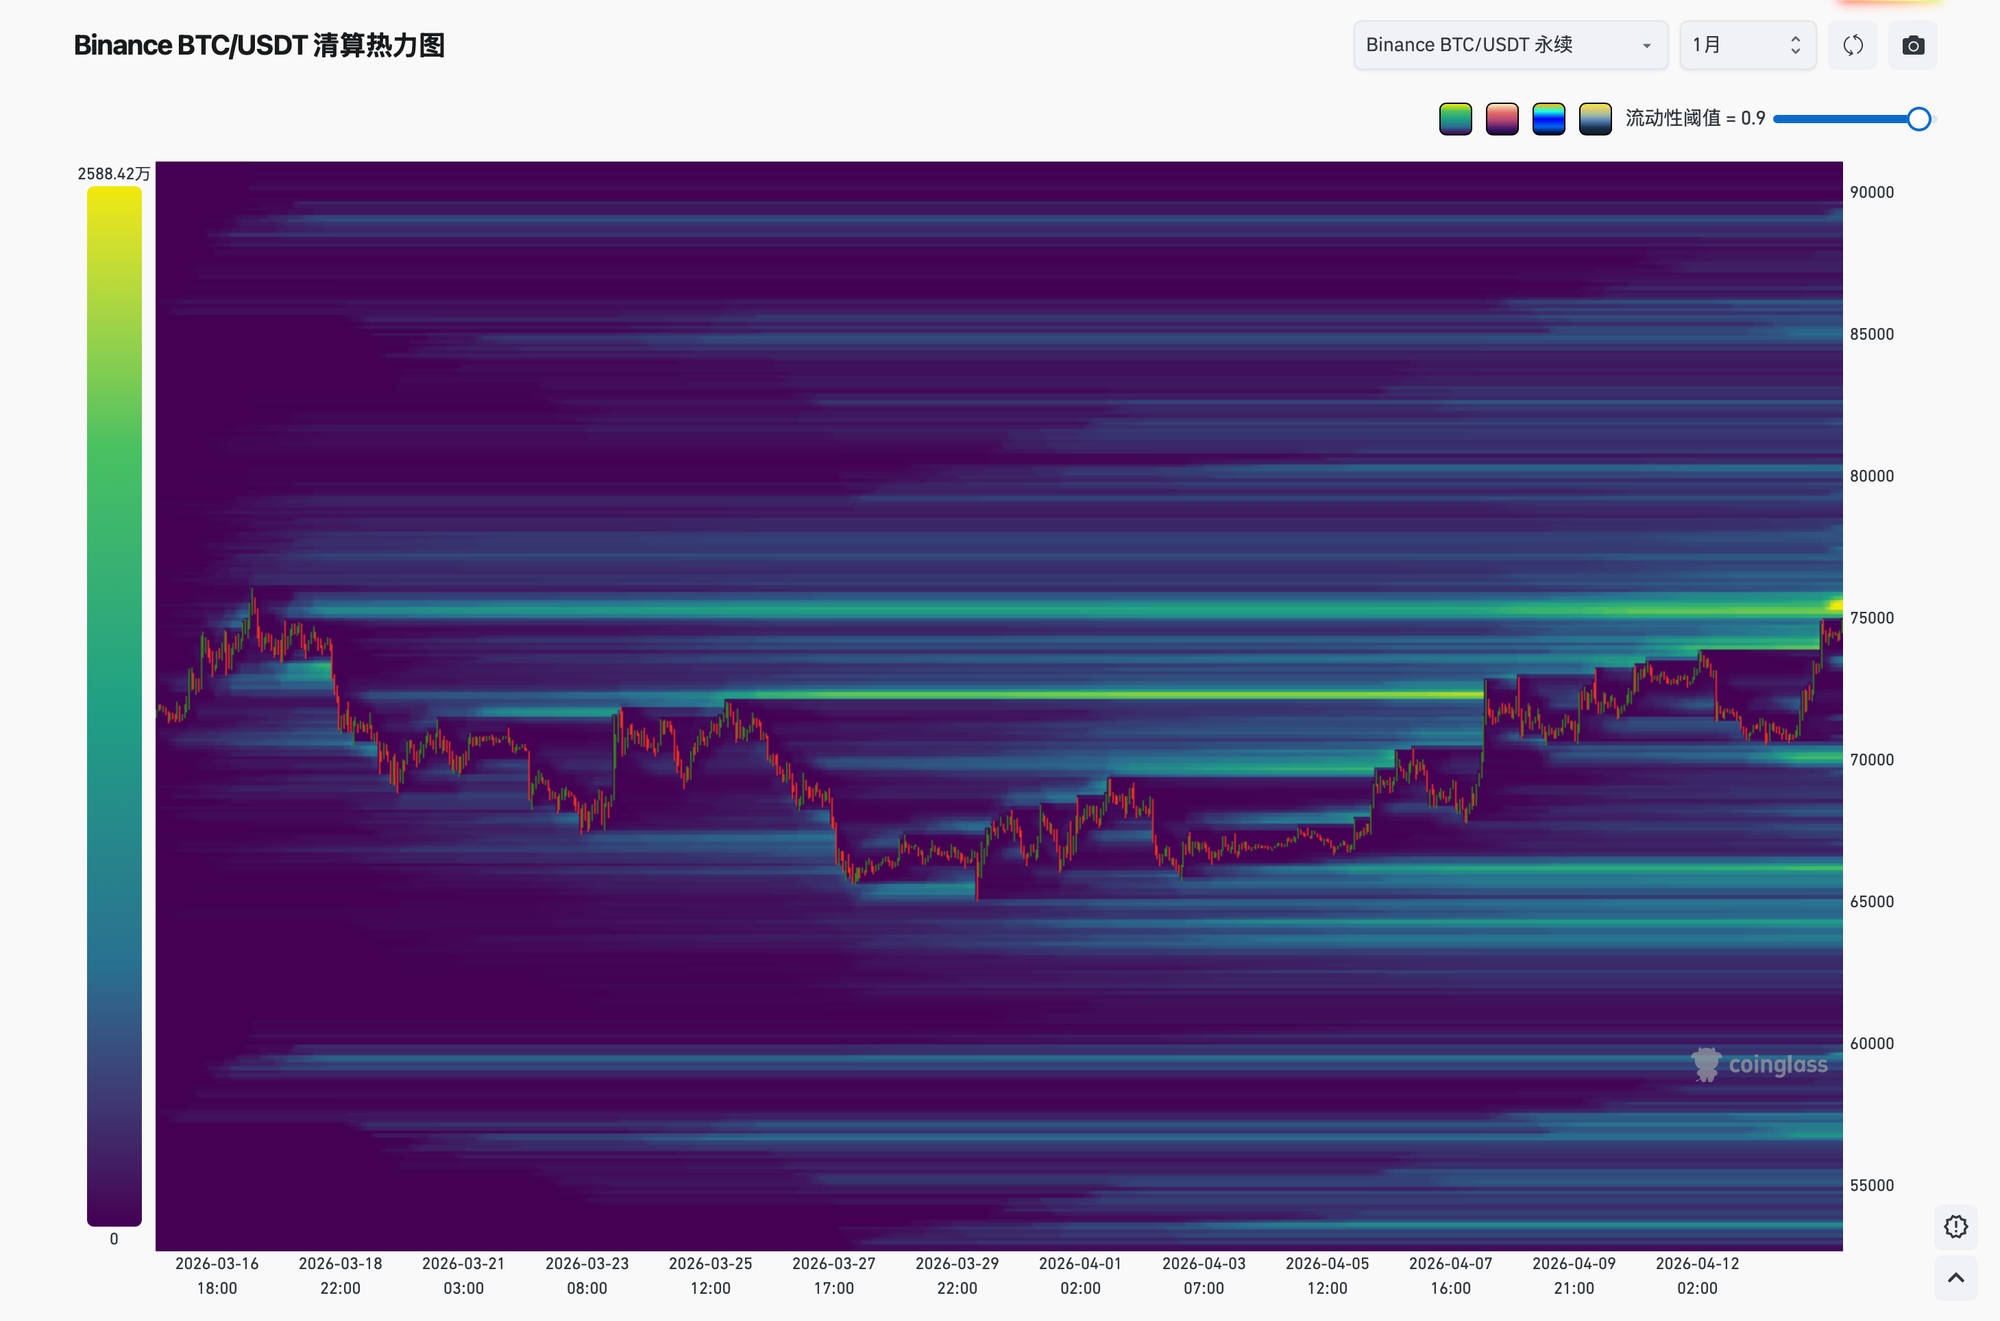
At this stage, adhering to a bearish strategy and enduring the necessary financial "pain" during the tail end of relief rallies is the only rational choice for the next two weeks of trading. We will substantiate our assessment of the market’s true cyclical phase through a cross-verification of the past week’s order flow, liquidity liquidation heatmaps, and a structural reconstruction of the bearish wave patterns on the K-line charts.
I. Institutional Iceberg Orders and Liquidity Hunting
In a zero-sum game characterized by a lack of substantial new capital inflows, the core challenge for institutional players remains how to smoothly distribute massive positions to retail participants without triggering a liquidity collapse or a price crash. Through recent order flow data and derivatives indicators, we have clearly identified the liquidity hunting trajectory of major capital.
1.1 Extreme Divergence Between CVD, OI, and Funding Rates
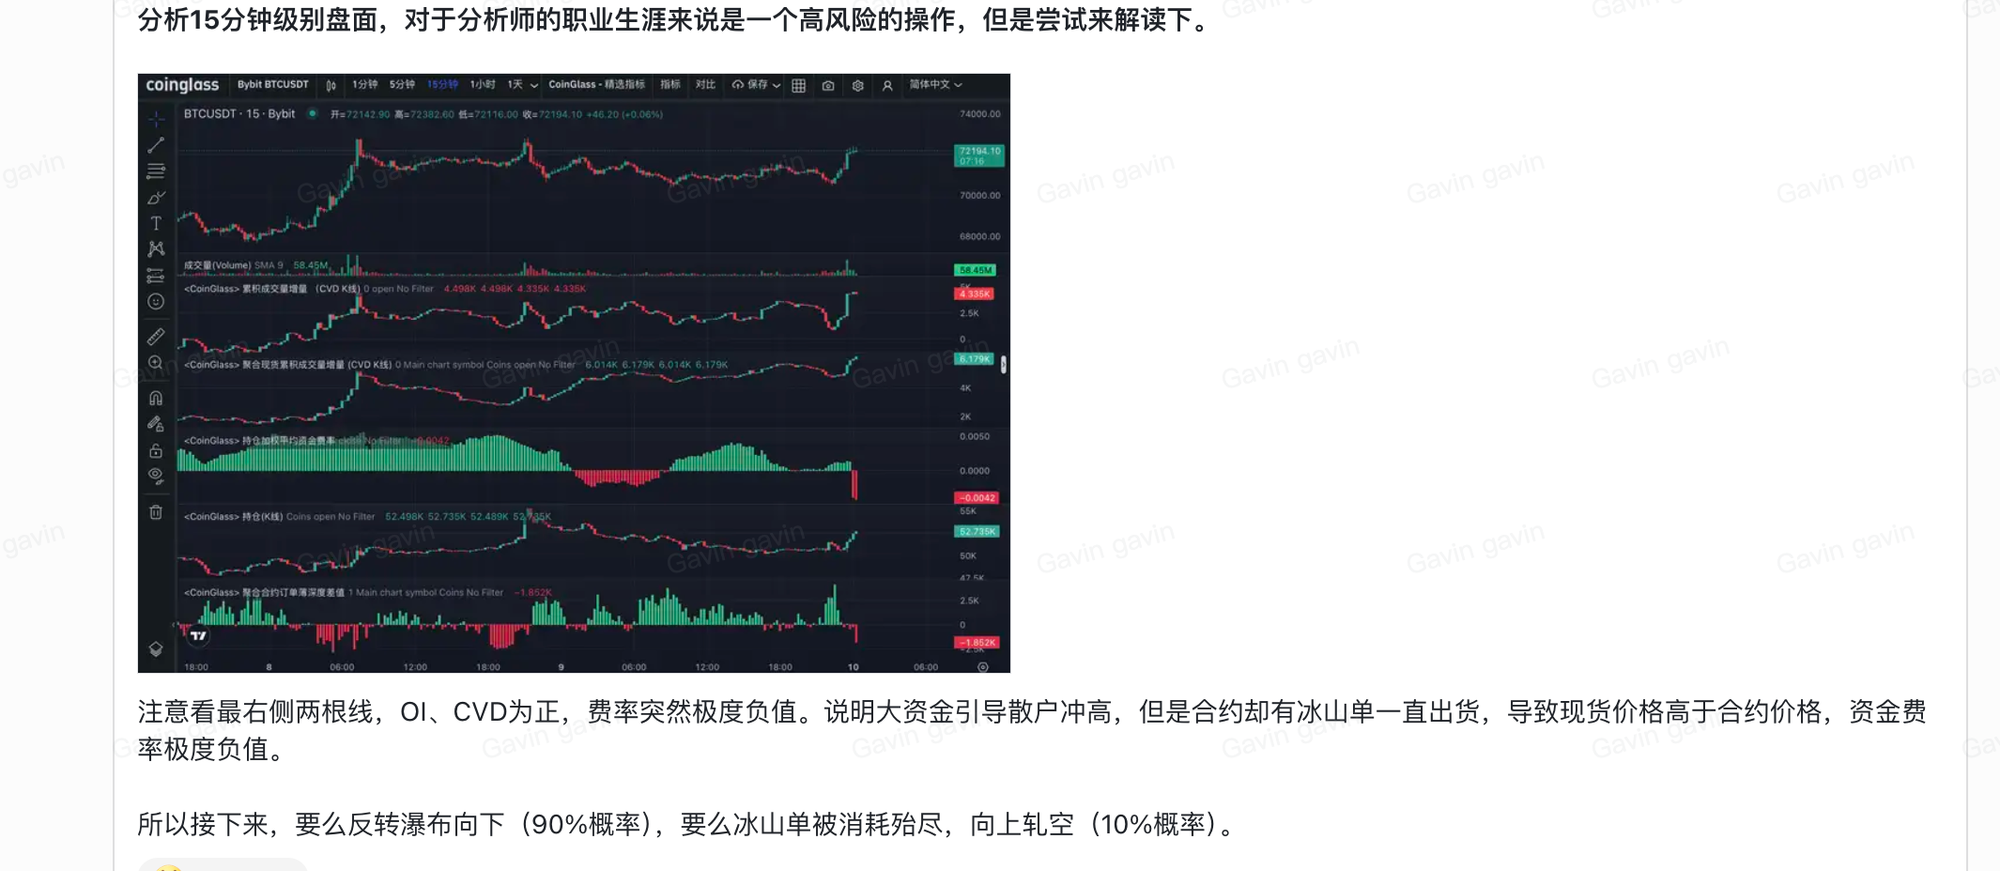
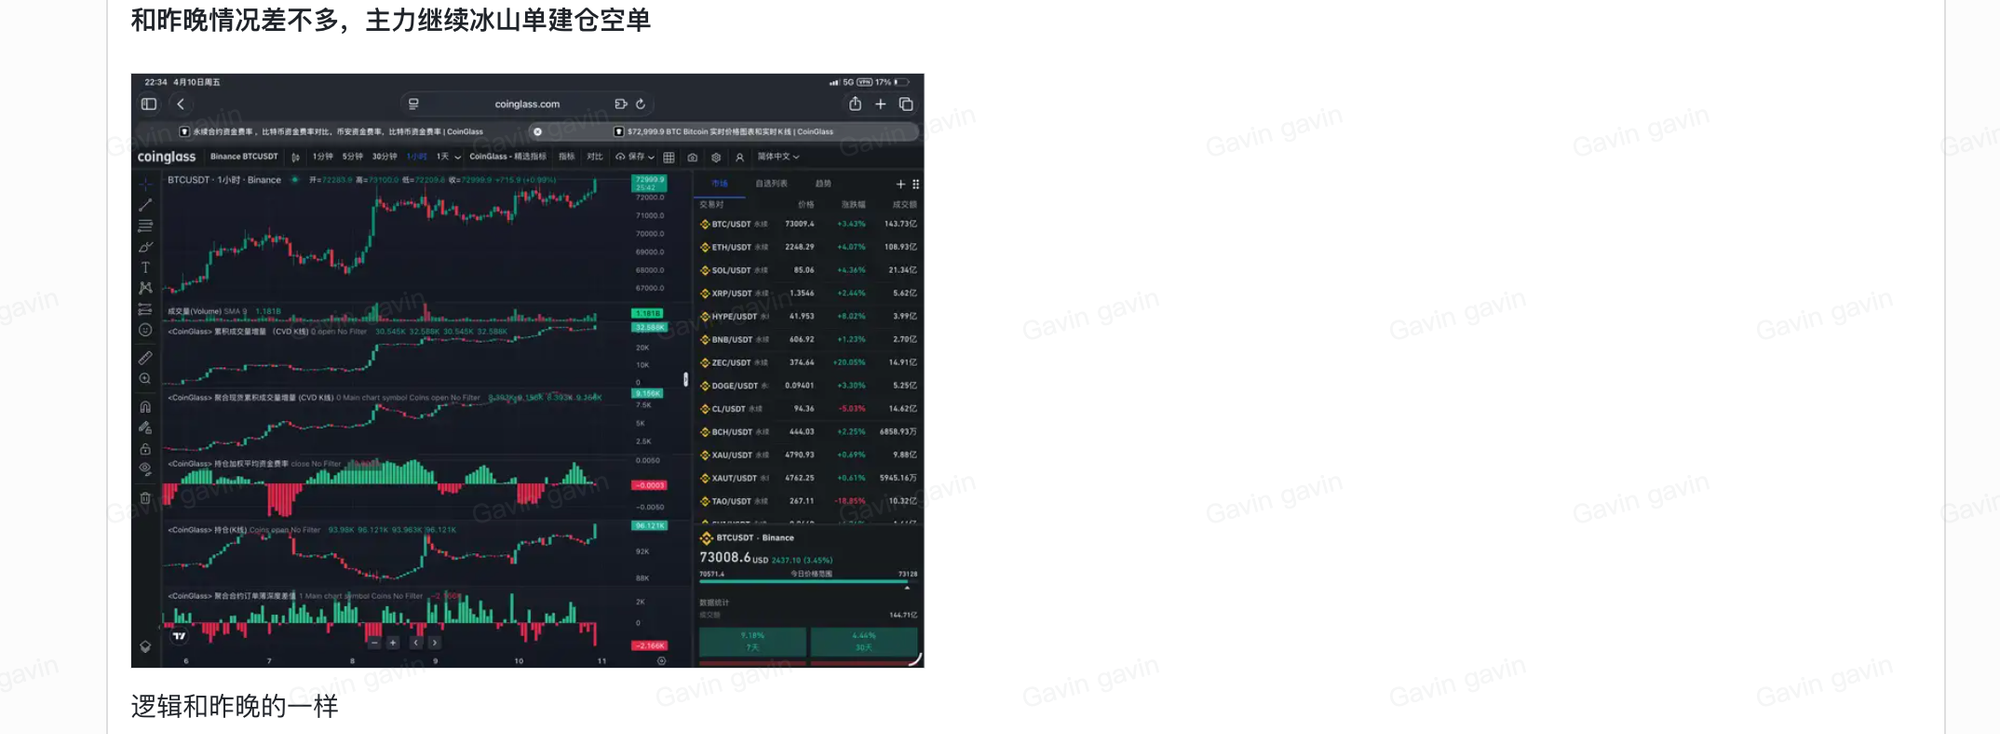
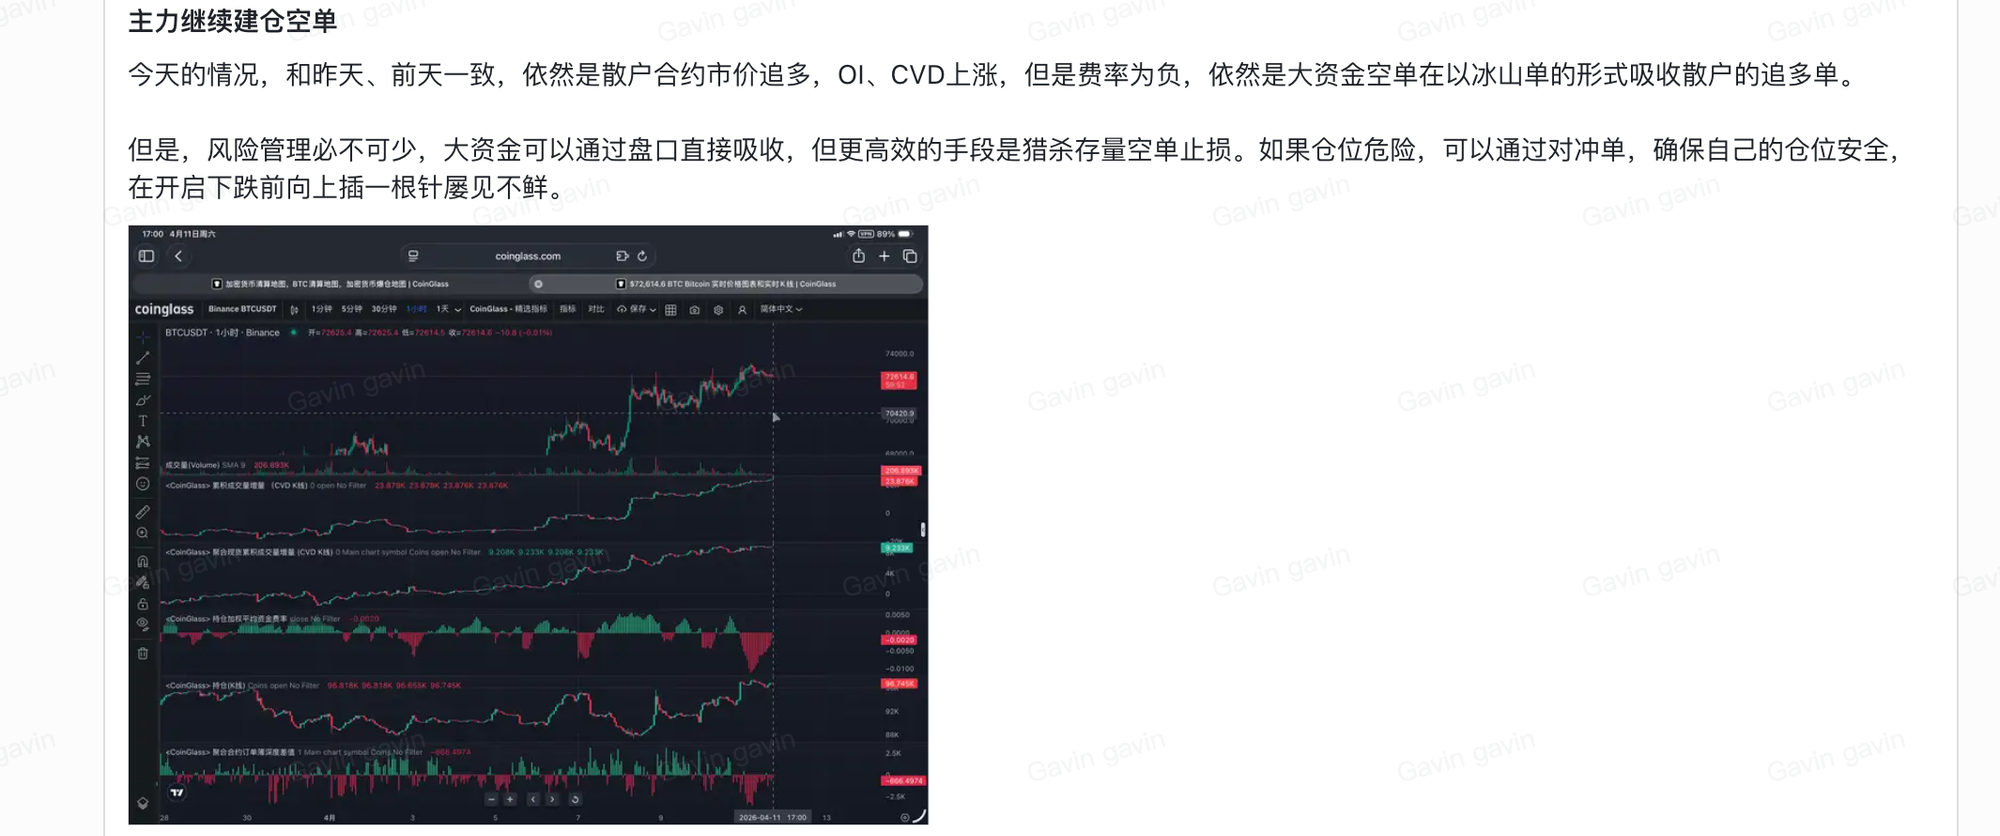

Over the past few sessions, we have repeatedly identified a highly atypical indicator divergence in the order flow. While Open Interest (OI) and Cumulative Volume Delta (CVD) showed significant synchronous positive growth, perpetual contract funding rates exhibited an extreme negative deviation.
This indicator profile reveals that retail participants, driven by market sentiment, were chasing longs via market orders, pushing CVD upward; meanwhile, new leveraged capital continued to enter the market, driving OI higher. However, perpetual contract prices remained lower than spot prices. This occurred because institutional capital was utilizing Iceberg Orders to densely layer sell orders within the contract order book.
Iceberg orders split large limit sell orders into microscopic fragments, making them invisible on the Order Book. As retail market-buy orders flood in, the Iceberg orders automatically replenish the sell side, acting as a "bottomless pit" that absorbs all bullish liquidity. The institutional short pressure suppressed perpetual prices, causing spot prices to remain significantly higher than contracts and driving funding rates into extremely negative territory. In a covert and efficient manner, major capital leveraged retail long-side FOMO to complete their short-position accumulation.
1.2 Precision Liquidity Hunting
In the process of distribution and short-side accumulation, besides passively absorbing retail longs through the order book, a more proactive and aggressive tactic is hunting the stop-losses of existing short positions.
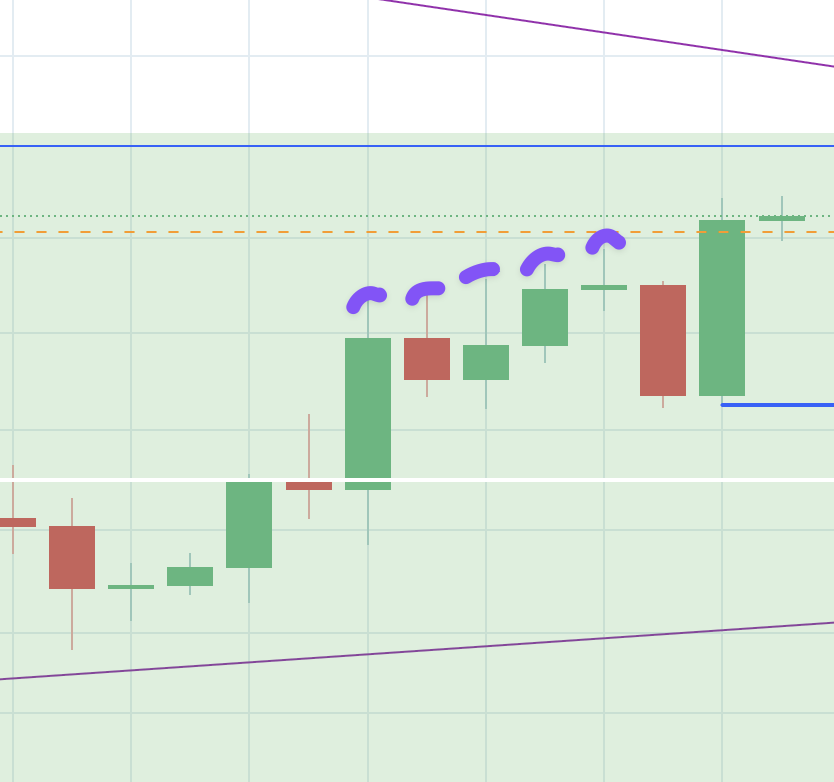
During the rally between $71,000 and $73,500, Bitcoin exhibited five consecutive days of marginal breakthroughs above local highs. This not only dealt a severe blow to the confidence and patience of bears but also systematically hunted the stop-losses of impatient, high-leverage short positions. The market-buy orders generated by these stop-losses were transformed into sell-side liquidity for institutional players.
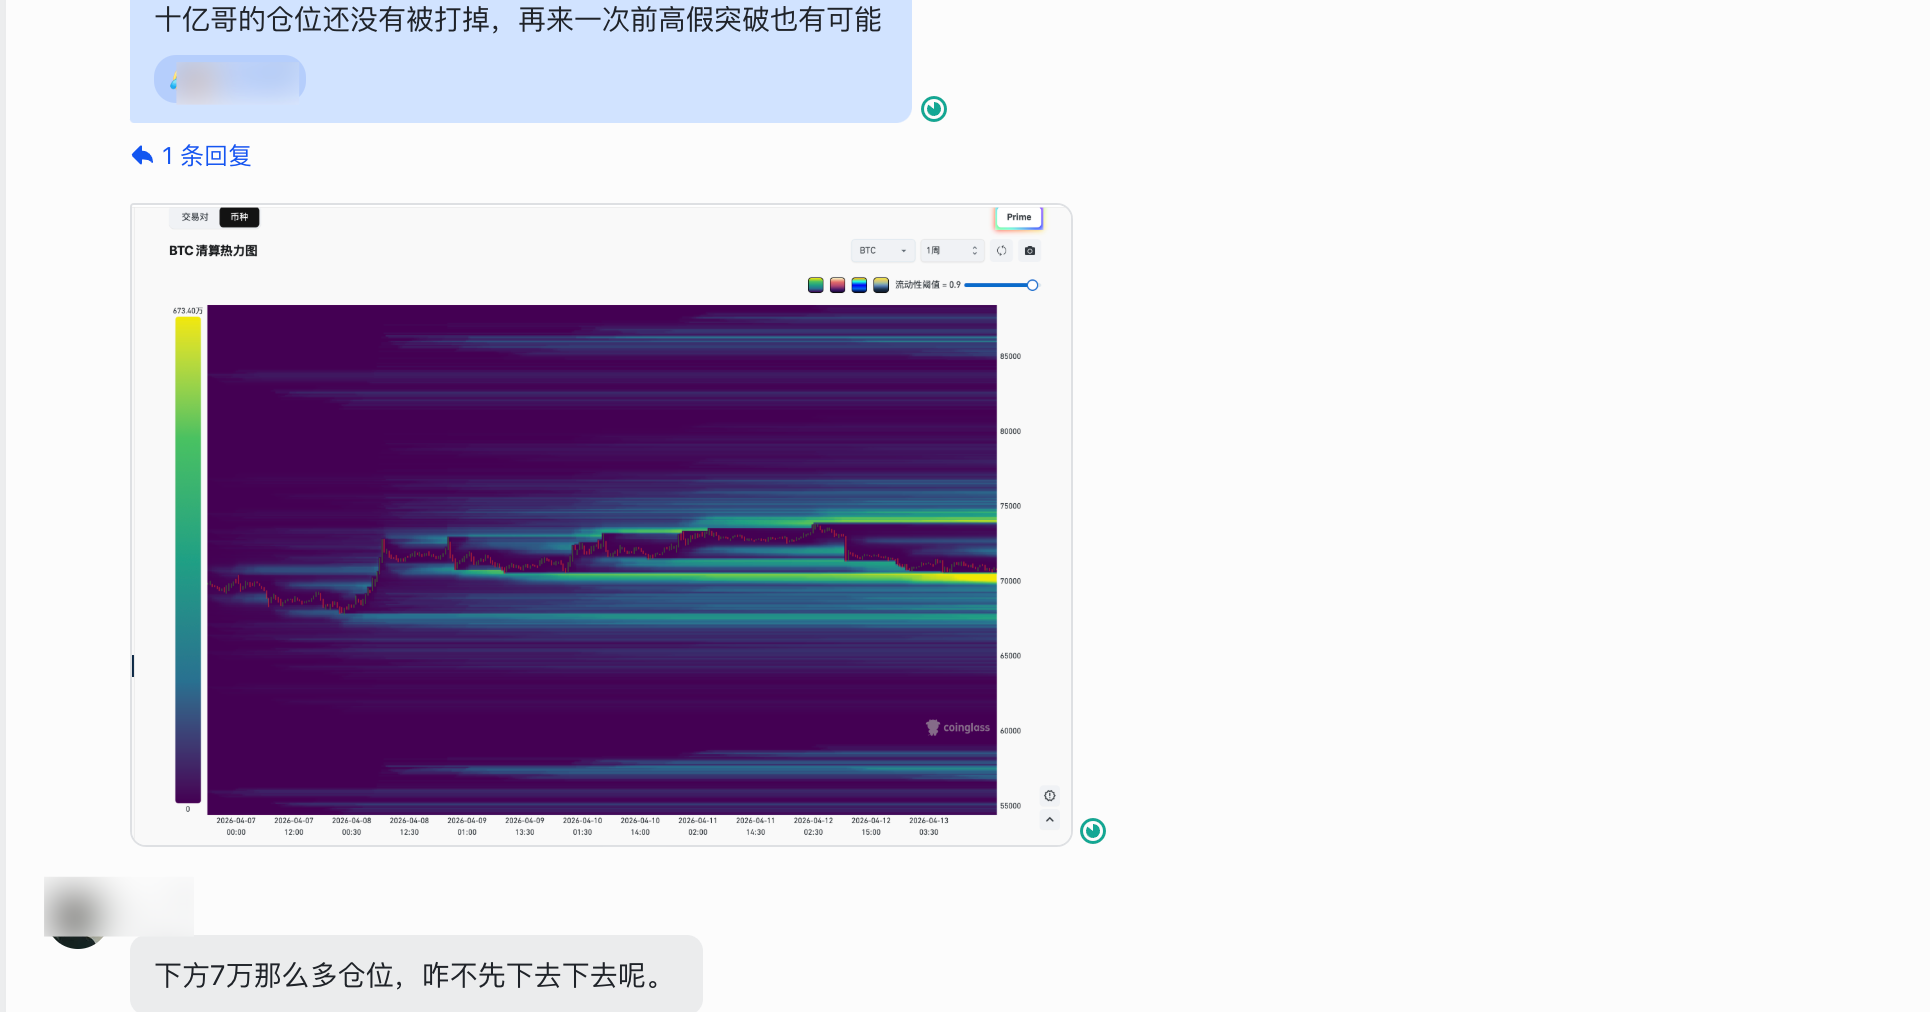
The price action over the weekend further validated this logic. As prices probed lower, we noted in our Diamond Member group: the massive short position held by the celebrity trader "Brother Billion" had not yet been cleared. The dominant players were highly likely to manufacture a fakeout toward the previous highs to harvest this specific liquidity. Entering a primary downtrend while carrying a "transparent" and oversized retail short position does not align with the core interests of the institutions that have consolidated here for months.
The price behavior following Monday’s U.S. close precisely realized this projection. Under low-volume conditions, prices were rapidly pushed higher; "Brother Billion’s" short position, along with a cluster of other retail shorts, was liquidated or stopped out. In the order book, a short-side stop-loss is equivalent to a market-buy order. These forced, price-inelastic liquidations provided abundant counterparty liquidity for the high-level Iceberg limit sell orders placed by major capital.
Institutional capital is hunting and absorbing liquidity in a very aggressive form. What appears on the surface to be a price breakout is, in reality, the climax of a liquidity transfer. Following this round of harvesting, the upside liquidity is nearing exhaustion, and the micro-momentum for further price appreciation will gradually dissipate.
II. Phase D of Wyckoff Distribution: The LPSY Stage
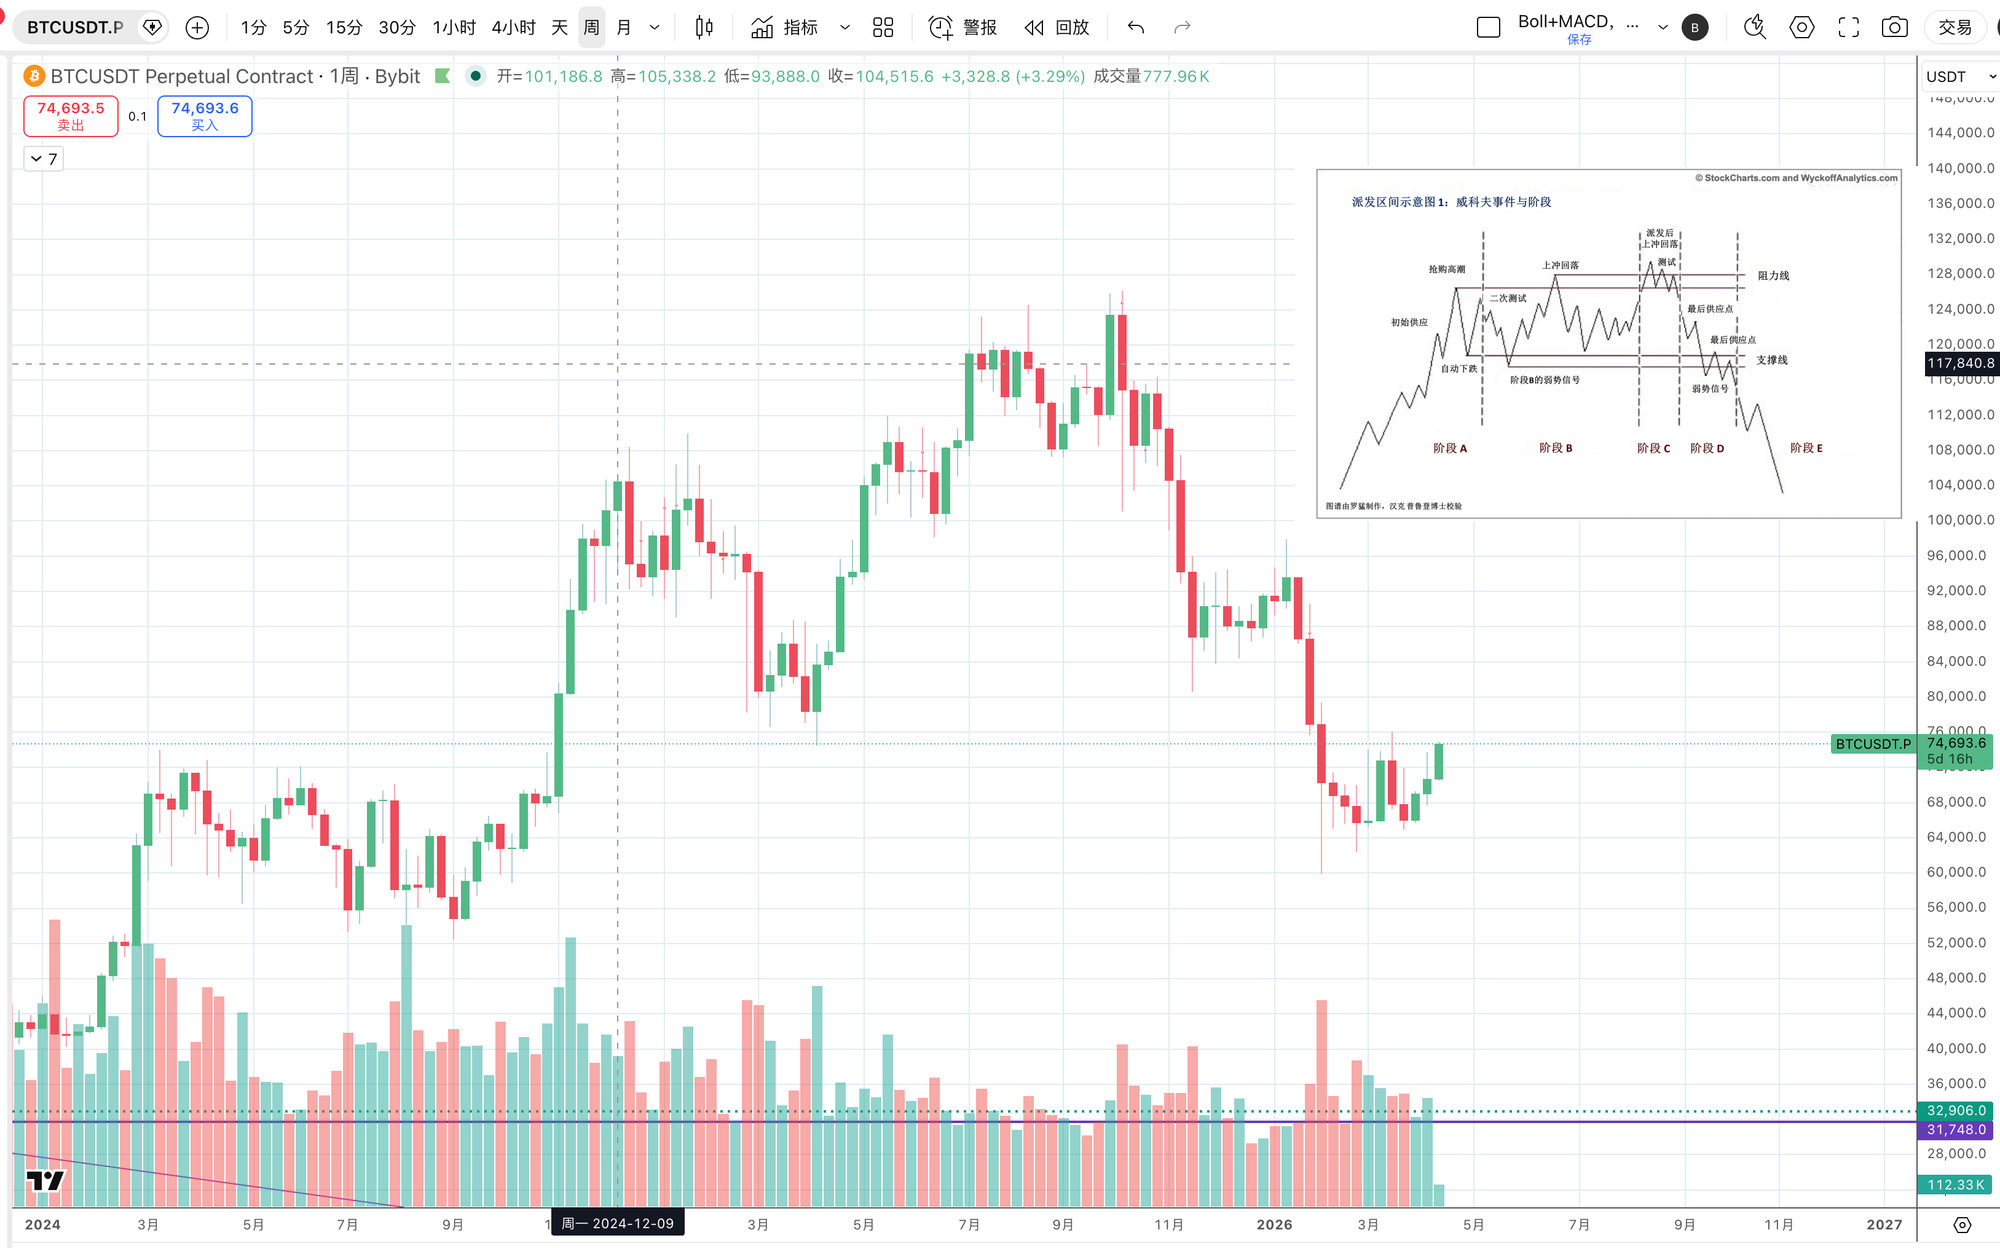
The Wyckoff Supply and Demand model remains the most effective theoretical framework for deconstructing institutional distribution and gaining insight into the internal shift of market power. The current prolonged sideways consolidation aligns perfectly with the progression of a Wyckoff distribution, with the market presently situated in Phase D—specifically within the Last Point of Supply (LPSY) zone.
2.1 Establishment of the Distribution Range and the Essence of Asset Transfer
The core logic of Wyckoff theory is based on the imbalance of supply and demand. Following an extended uptrend and preceding a shift into a markdown phase, the "Composite Man" (described in crypto as institutions, long-term investors, and ancient whales) begins transferring massive holdings to the general public entering under FOMO sentiment at the end of the trend. Due to the sheer volume of their holdings, they cannot exit at a single price point and must construct a wide trading range.
Observing recent price structures, the market has fully completed the first three phases of the distribution model:
- Phase A (Stopping the Trend): Late 2024 to January 2025. The market topped during an extreme high-volume Buying Climax (BC). The subsequent Automatic Reaction (AR) and Secondary Test (ST) established the boundaries of the distribution range.
- Phase B (Building Cause): January to July 2025. This is the most time-consuming phase of the distribution. Institutions manufacture massive volatility—using panic to test underlying support and leveraging positive news to rally prices and distribute bags. A key characteristic here is expanding volatility, with volume during rallies ($76,000–$120,000) being smaller than volume during declines ($108,000–$76,000), signaling a shift in supply-demand dynamics.
- Phase C (The Ultimate Test and Trap): The market experienced the final major deception—the Upthrust After Distribution (UTAD). This was the exact position identified in our October 2, 2025, report where we directed a full pivot to shorting. This candle, which pierced the upper boundary of the range on high volume, was designed to manufacture an illusion of a bullish breakout, inducing final breakout buyers while clearing remaining short-side obstacles.
2.2 Phase D and LPSY: Chart Evidence of Demand Exhaustion
Following the UTAD’s mission of liquidity harvesting, price failed to sustain highs and rapidly collapsed back into the trading range, marking the official entry into Phase D. This phase is entirely dominated by supply, characterized technically by the alternation of Signs of Weakness (SOW) and Last Points of Supply (LPSY).
We are currently in the deep-water zone of this phase. Reviewing recent relief rallies, we can summarize the key characteristics of the current cycle’s LPSY:
- Price-Volume Divergence: Candle bodies expand during rallies while volume contracts. The market lacks substantive follow-through capital; these "rallies" are largely driven by short-covering or liquidity algorithms. Once key resistance is hit, bearish candles expand rapidly on surging volume, indicating that latent supply has taken control.
- Support-Resistance Flip: Previous swing lows that served as support during the bull trend have now flipped into resistance as price attempts to retest them from below. These lower highs on the corrective bounce represent the LPSY—the final locations for institutional large-scale offloading.
The current price action can be understood as the final transfer of chips to impatient bottom-fishers. This is a mandatory and brutal stage in the macro cycle. Once the LPSY is confirmed, the market will slide into Phase E (Markdown Phase), where price enters a free-fall to seek a new value equilibrium. For the most committed bears, it is natural to feel doubt at this stage, but through rigorous comparison with the Wyckoff model, we reaffirm that maintaining a bearish strategy remains logically sound and structurally disciplined.
III. Algorithmic-Driven Wave Consistency and the 2022 Fractal Recurrence
Through micro-order flow, we revealed the specific maneuvers of institutional players; through the Wyckoff model, we exposed the macro intentions of capital. Now, the macro-scale candlestick patterns demonstrate the objective market laws dominated by algorithms and programmatic trading. While the price action itself is the result of the combined forces and full engagement of bulls and bears—and cannot serve as a 100% predictive tool—we can still peel back the layers to find clues that align with human psychology and algorithmic evolutionary paths.
3.1 The Law of Wave Consistency After Noise Removal
In the highly institutionalized Bitcoin market, programmatic high-frequency trading (HFT) holds absolute dominance. The core logic of algorithmic systems is often built upon backtesting historical data and pattern recognition, which causes price action to exhibit stunning similarity or repeatability within identical cycles. Through years of observation and application, we have found that this is by no means accidental, but an inevitable result driven by mathematical models.
When we discard the "wick" candles triggered by extreme leverage liquidations and return to the purest trend analysis, we find that the current downward trajectory is strictly following the consistency principles of Elliott Wave Theory.
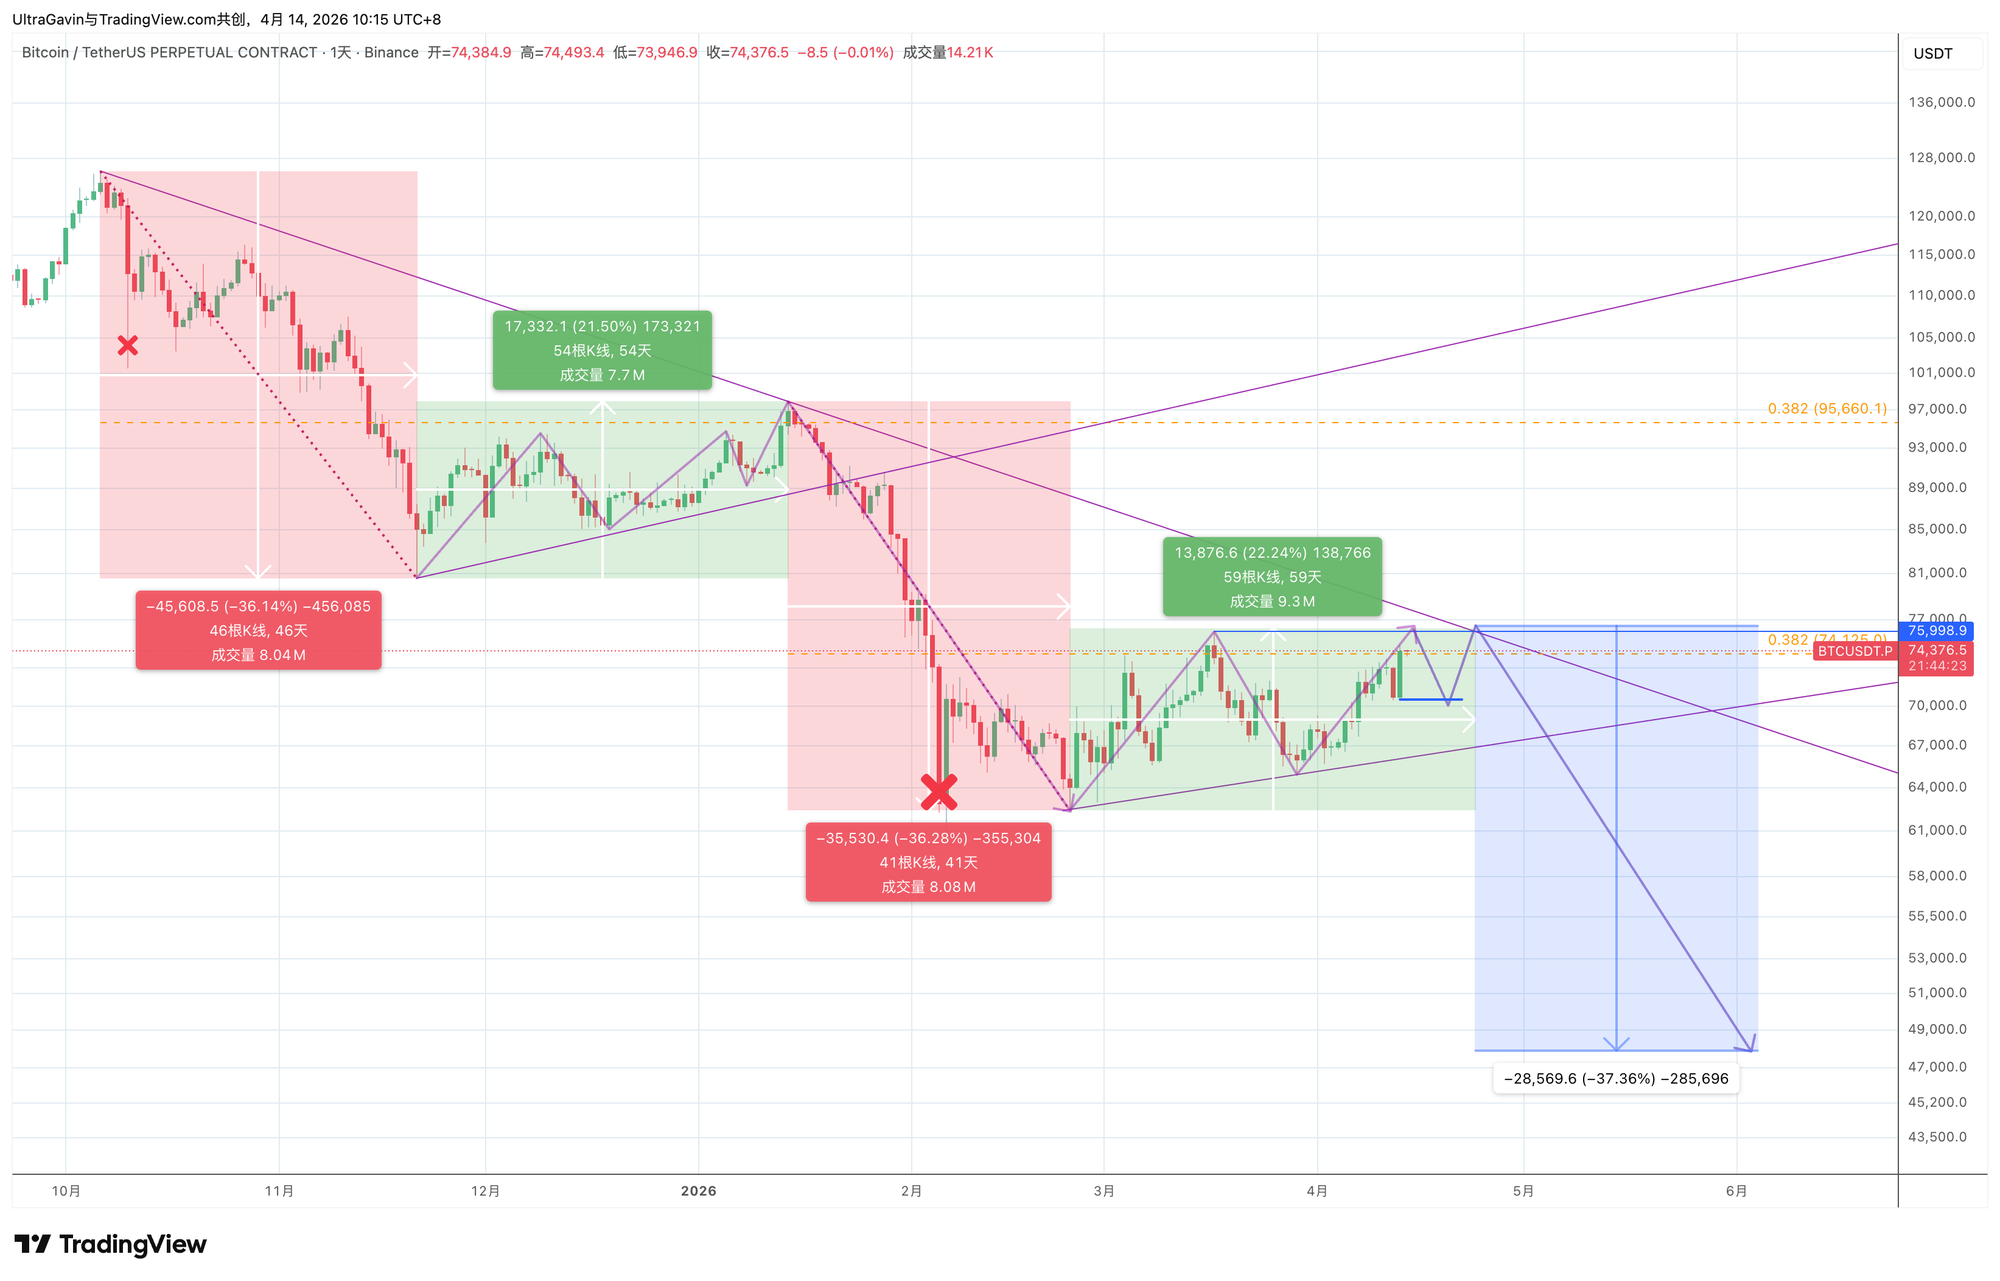
Elliott Wave Theory dictates that market trends typically unfold in a five-wave structure: three motive waves (1, 3, 5) and two corrective waves (2, 4). Furthermore, there often exists a Fibonacci proportional relationship and spatio-temporal symmetry among these three motive waves.
As shown in the chart above, we are currently at the terminal stage of a macro-level Wave 4 relief rally or the inception of a Wave 5 decline. More incredibly, in the preceding impulsive waves down, the market has shown a high degree of convergence across three core dimensions: "Volume," "Percentage Decline," and "Time Cycle." According to our measurements:
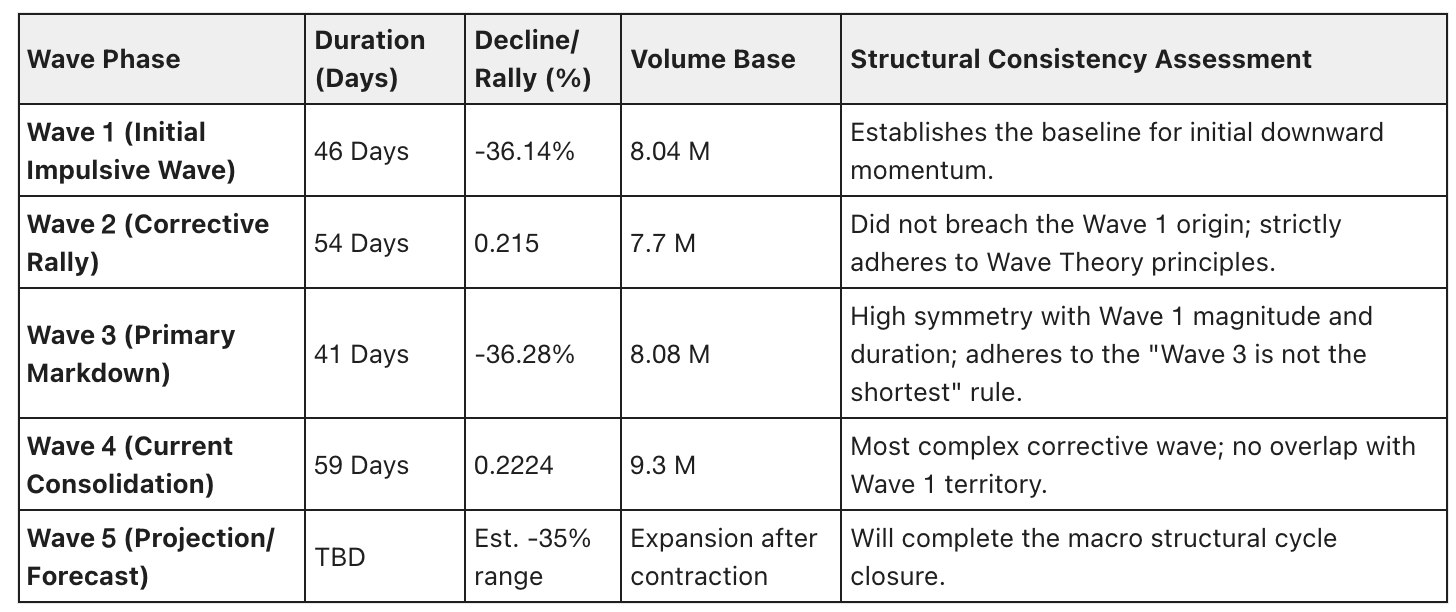
Wave 1 and Wave 3 exhibit near-perfect symmetry in terms of price decline (approximately 36%) and volume levels (approximately 8M). According to our mapping, if the terminal point of Wave 4 touches the descending trendline, the cumulative time for Waves 1 and 2 is perfectly identical to the cumulative time for Waves 3 and 4—both totaling 100 days.
3.2 The 2022 Historical Fractal Recurrence
A cornerstone principle of technical analysis is that history repeats itself. The current market structure shows a startling mirror-image coincidence with the pattern seen in 2022, when Bitcoin plunged from the $69,000 cycle top to the $15,500 bottom.
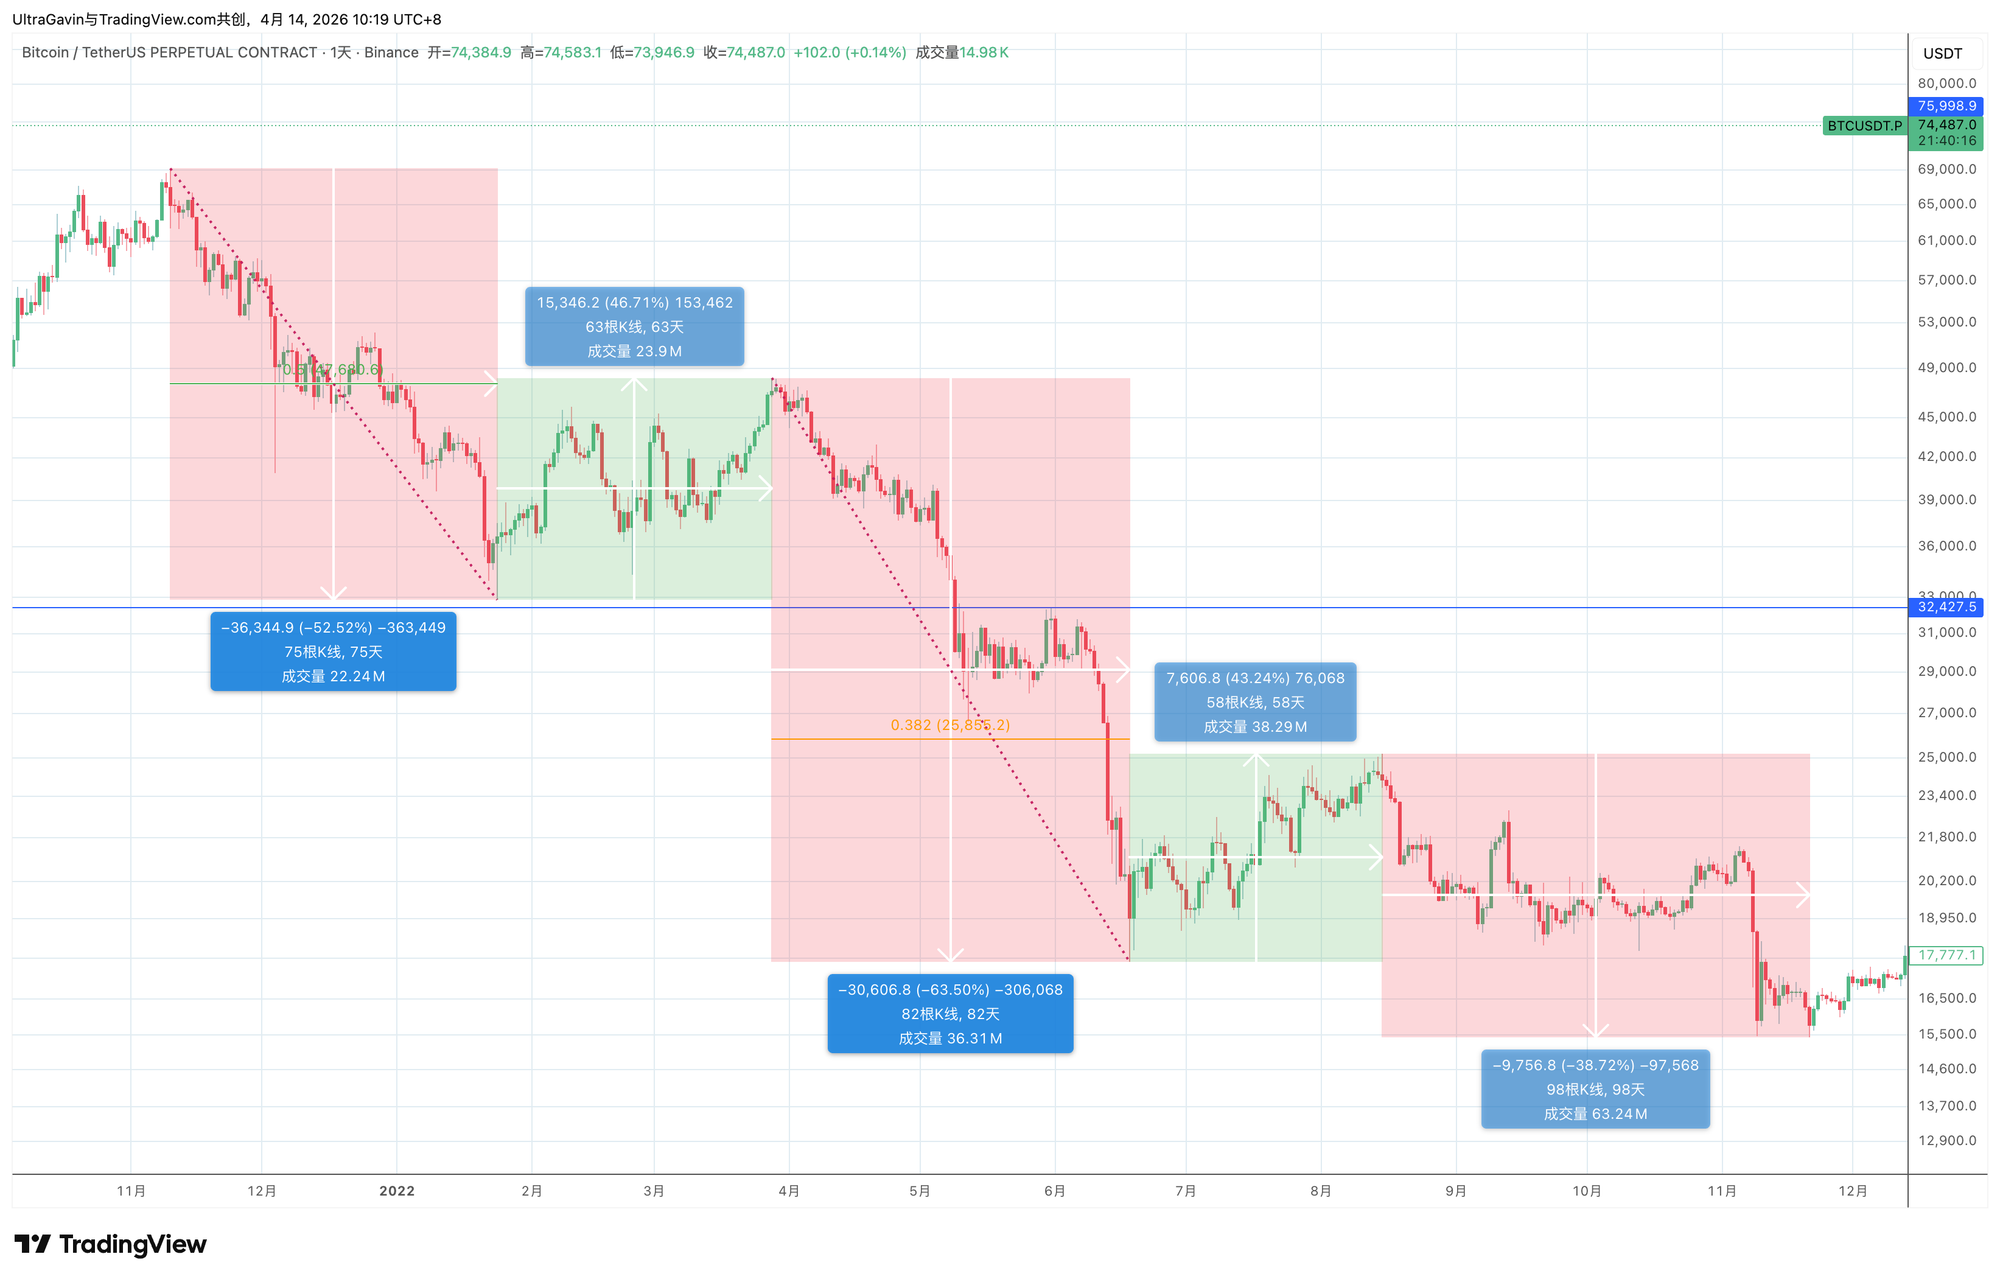
Combining this with the current tape, we project that the price action over the next ten days or so will be of landmark significance. The market is highly likely to construct a localized parallel top and then utilize a violent fakeout—potentially even briefly piercing the descending trendline since the bull market peak—to complete the final UTAD liquidity hunt. This would definitively conclude the current rally, followed by the commencement of a smooth and deep Wave 5 decline.
IV. Fundamental Analysis: The Bear Market Persists
Beyond pure capital interplay and technical patterns, we return to the underlying asset logic of Bitcoin. Any discussion regarding bull and bear cycles is meaningless if it ignores Bitcoin’s productive attributes as a Proof-of-Work asset. Bitcoin is an asset devoid of traditional earnings or fundamental support, driven by pure capital liquidity dynamics. Its long-term price discovery mechanism is co-determined by daily new supply (miner selling pressure) and market absorption capacity (buying demand).
When prices are elevated and the purchasing power of new capital inflows is insufficient to offset the sell-side liquidity generated by miners paying fiat bills, the bull market peak quietly arrives. Conversely, when prices have undergone a deep cleansing, most chips have transferred into the hands of "Composite Men" capable of long-term locking, and even weak market purchasing power is enough to digest steady miner selling, the market bottoms out. At this point, the wealth effect re-emerges, initiating the next cycle. This is the foundational logic of Bitcoin’s bull and bear cycles.
4.1 The Economics of Hashrate Revenue Post-Halving
"The following contains high-value Alpha trading opportunities, accessible only to Platinum and Diamond members. To prevent Alpha decay caused by crowded strategies, do not redistribute. Join our paid membership for full access."
The April 2024 Bitcoin block reward halving was the turning point that reshaped Bitcoin’s supply-demand landscape. Block rewards were slashed from 6.25 BTC to 3.125 BTC. With global hashrate sustained at historical highs, this directly doubled production costs for miners while halving systematic steady selling pressure.
While some highly centralized, publicly traded mining firms with exclusive renewable energy agreements—such as MARA, CleanSpark, and Bitdeer—can drive their direct cash costs down to the $34,000 to $43,000 range, this only accounts for direct electricity expenses. Furthermore, it far from represents the average survival condition of the global hashrate.
When considering full life-cycle costs—including equipment depreciation, payroll and stock-based compensation, facility rent, hardware maintenance, and interest expenses—the entire industry is essentially operating at a loss. Mining research institutions estimate the current comprehensive production cost for the median publicly traded mining firm to be between $74,600 and $87,000.
4.2 Irreversible Structural Selling Pressure
Unlike speculators, miners are among the largest forced sellers in the Bitcoin network. Power providers and hardware manufacturers do not accept Bitcoin; mining firms must face massive monthly fiat-denominated bills.
Theoretically, due to this ongoing state of unprofitability, Bitcoin’s selling pressure at this stage is exceptionally stable and continuous. Sporadic market rallies—such as those driven by impulsive purchasing from MicroStrategy—are simply insufficient in volume to offset this daily, structural selling of thousands of BTC over the long term. Therefore, as long as the inversion between miners' full life-cycle costs and the spot price remains unrepaired through a deep decline that triggers a mass hashrate capitulation and a collapse in difficulty, the underlying logic of the bear market remains valid.
V. The MicroStrategy Distraction
Having explored technicals, order flow, and fundamentals, we now analyze the market's primary distractor: the MicroStrategy purchasing narrative. Many traders hesitate in their short strategies specifically because they see giants like MicroStrategy continuing to accumulate.
Last week, MicroStrategy issued $1 billion in STRC to purchase 13,927 BTC at a relatively high average price of $71,902. To the average retail trader, this appears as an extremely strong bullish endorsement. However, from a professional macro perspective, we must re-examine this event through the lens of liquidity gaming.
First, MicroStrategy’s purchase is funded by issuing preferred stock with a fixed dividend (11.5%), increasing their financial pressure for rigid repayment. While we believe it is safe in the short term, the crucial point is that in a market where large capital seeks to distribute, such a high-profile, massive "transparent" buy is precisely the liquidity-generating event the "Composite Man" craves.
As discussed regarding Iceberg orders: when MicroStrategy’s $1 billion buy order and the retail FOMO triggered by the news entered the market, it theoretically should have caused a violent price surge. Instead, Bitcoin’s price saw only a minor pulse before stagnating or retracing. What does this indicate? It shows that above this price range, there is a "bottomless" supply of institutional distribution via hidden sell orders. This $1 billion buy did not break the downtrend; rather, it was fully absorbed by high-level Iceberg limit orders, serving as the ultimate exit liquidity for major capital.
We believe equating specific, impulsive buying behavior to a "bull market engine" is extremely dangerous. In the Wyckoff model, this behavior acts exactly as the catalyst for high-level chip exchange during the LPSY stage.
VI. Strategic Resolve: The Trading Philosophy of Enduring Necessary Pain during Relief Rallies
As stated at the beginning of this report, we return to our core philosophy. After a comprehensive, deep-dive review of order flow, wave fractal recurrence, Wyckoff distribution phases, miner selling pressure, and institutional liquidity traps, we firmly believe the macro short strategy formulated by Prism Insights over the past two months is entirely correct and logically rigorous.
Undeniably, the recent tug-of-war during the LPSY stage and the precision hunting of short positions by dominant players have brought floating losses to short accounts and significant psychological tests to traders. However, we must profoundly understand the essence of the art of trading.
In the terminal phase of Wyckoff distribution, institutional manipulation is bound to be extreme and brutal. They must destroy the last group of rational bears through constant fakeouts and frequent stop-loss triggers while luring the most fanatical bulls to buy at the highs. In this process, the drawdown and psychological attrition experienced by short sellers are inevitable consequences of the market mechanism.
We must establish this philosophy: Long-term stable profitability is a compensation for the trader's ability to endure the pain of irrational volatility and adhere to a rigorous logical system; it is not a reward for impulsive trading, following the crowd, or emotional chasing of highs and lows. In the terminal stage of a macro market trend, where bull and bear forces engage in their most desperate battle, enduring pain is perfectly normal and necessary.
Tactical Refinement Recommendations
The current rally is merely a "dead cat bounce" in a bear market cycle—the final distribution of chips from "Smart Money" to "Weak Hands." Our strategic judgment remains unchanged, but we must refine our tactical execution to handle extreme bull traps:
- Position and Leverage Management: Given that dominant players may utilize extreme news or even a fakeout above the previous $76,000 high for a final stop-hunt before Wave 5 begins, you must strictly control leverage. Set liquidation prices beyond absolute safety thresholds to avoid falling just before the dawn.
- Abandon Illusions of Breakout Longs: Do not be deceived by any candle piercing the upper range boundary. Treat these exclusively as UTAD (Upthrust After Distribution) liquidity traps.
- Awaiting the Storm: Adhere to the short strategy and refuse to be swept up by superficial frenzy. As we reach the tipping point where buy-side liquidity finally exhausts, we will reap the substantial rewards of strategic resolve during this macro-cycle price re-evaluation.
Disclaimer:
The information and views contained in this research report represent the judgment of the Prism Insights analytical team and are considered reliable as of this date, but their accuracy or completeness is not guaranteed. The cryptocurrency market is a high-risk investment field with volatile prices and inherent leverage risks. This report does not constitute direct investment advice, financial advice, or an invitation to trade. Investors should make independent investment decisions based on their own risk tolerance and strictly implement stop-loss strategies. Prism Insights assumes no responsibility for any direct or indirect losses resulting from the use of the content of this report.