
Chapter 1: Finding Certainty in the Fog of Probability
1.1 Reflection at the Crossroads
The financial market is never a static digital landscape; it is a dynamic ecosystem woven from collective psychology, liquidity games, and structural mechanics. As Chief Analyst at Prism Insights, my duty is always to cut through the fog of noise and provide our members with the kind of clarity that guides action even in chaos. This clarity, however, comes not only from accurate forecasting but also from a rigorous self-examination of our past analysis.
We stand at a critical inflection point in the crypto market cycle—the twilight hour where frenzy has not entirely faded, but despair has not fully arrived. As predicted in our previous reports, Bitcoin's collapse from the all-time high of $125,000 was not random but a structural necessity. However, the market's behavior after tagging the key pivot point of $88,000 did not entirely follow our anticipated rally script; instead, it played out a more complex liquidity game.
At this moment, we must be honest with the charts, the data, and every trader who trusts us. Our call on the $125,000 top (UTAD) was perfect, yielding us over 35,000 points in realized downside profit. But at the $88,000 level, our conviction in the "counter-trend long" led us to underestimate the market's inertial trend. The subsequent drop after the price rallied to $93,000 is a critical feedback loop for our analytical framework...
1.2 The Dual Mission of This Report
First, this is a forensic audit of our own performance. We will conduct an exhaustive review of the market action between $88,000 and $80,607. This is not merely to acknowledge our tactical error in calling for a counter-trend long at $88,000, but to demonstrate how a professional analytical team evolves through rigorous self-examination. We will dissect the limitations of "left-side" (contrarian) trading within specific liquidity environments and analyze how we overlooked that fatal Fair Value Gap (FVG). This radical transparency is the bedrock of the trust we share with our members.
Second, this is a survival and profit guide for the next eight weeks. We formally confirm: The structural bear market has arrived. The first phase of "easy mode" directional profit is ending. We are now entering a massive, two-month consolidation period. This phase is defined as "Hell Mode"—a meat grinder designed to liquidate high leverage and erode patience. For the unprepared majority, this will be a nightmare. But for Prism Insights members holding the map, this is the golden window for accumulation.
This report is divided into a free public section and a core paid section.
- The Public Section will comprehensively detail the logic behind the macro bear confirmation, the theoretical basis for the consolidation phase, and the psychological traps ahead, helping you see the board clearly.
- The Paid Section abandons theory for direct action. It provides high-precision tactics based on the current order book—including aggressive market-buy strategies and conservative breakout-long strategies.
The market has changed. The rules of engagement have shifted. Below is the ultimate guide to restoring order from the chaos.
Chapter 2: A Forensic Audit of the $88,000 Pivot—Why We Closed Shorts and Flipped Long
2.1 The Trap of Linear Extrapolation and Recency Bias
After successfully predicting the epic collapse from $125,000 to $88,000, a subtle psychological inertia—recency bias—quietly infiltrated our decision-making process. As we celebrated the perfect execution of the "Main Cascade Endgame" in our previous report, we subconsciously assumed the market would continue to adhere perfectly to our script.
Our call to take profit on shorts at $90,000-$88,000 and flip long was a serious tactical miscalculation. While we were strategically correct regarding the macro setup (an oversold bounce was due), this masked a tactical arrogance. We ignored a fundamental law of market physics: while momentum is finite, inertia is powerful.
After a 37,000-point unidirectional drop, bearish momentum was indeed exhausted. Smart money that shorted the top needed to realize profits, and value buyers began layering limit orders. However, we underestimated the cascade of forced institutional stop-losses and the crushing weight of broader equity and macro headwinds.
2.2 $80,607: The Overlooked Algorithmic Inevitability
To understand why the market found a floor precisely at $80,607, we must introduce the core concept of the Fair Value Gap (FVG). This is a technical detail we touched upon in our last report but failed to weight heavily enough.
The Micro-Mechanism of the FVG: An FVG is a price vacuum created by an extreme imbalance between buying and selling pressure. During Bitcoin's violent run-up to $125,000, price action left a massive "efficiency gap" on the buy-side between $78,000 and $82,000. In this zone, price advanced solely on aggressive market buys without matching limit sells, creating a structural dislocation in the order book.
For the quantitative algorithms and high-frequency trading systems that dominate the current crypto market, these FVGs are not meaningless white space; they are liquidity black holes—magnets that must be repaired. The market abhors a vacuum, and algorithms abhor unfilled orders.
The drop to $80,607 was not a random expression of market panic; it was a precise, surgical remediation operation.
- Liquidity Repair: Price pierced the 78k-82k FVG zone, achieving a 100% fill of the buy-side liquidity vacuum left since the April 2025 rally.
- Algorithmic Trigger: The $81,000 level also corresponds to the 0.618 Fibonacci retracement from the September 2024 low—a standard automated buy trigger for large-scale institutional algos.
2.3 Deep Reflection: The Boundaries of Counter-Trend Execution
"Left-side" trading implies entering a position against the momentum before a reversal is confirmed. Our short at the $125,000 top was a successful left-side trade because it was confirmed by a confluence of Wyckoff distribution structures and macro exhaustion signals.
However, at $88,000, we committed a classic reversal error. By longing the support ($88,000), we were effectively gambling that the support must hold. This violates the first principle of trading: Short at resistance; observe at support.
$80,607 has now become the bulls' last bastion. As long as this level holds, the immediate crash script is temporarily suspended. We must respect this new market information and shift our mindset from a "one-way short" bias to a "range-bound game."
Chapter 3: The Bear Market is Confirmed—Why This Bounce is NOT a Bull Market Return
Although we acknowledge our tactical misstep at $88,000 and are repositioning for this bounce, Prism Insights must reiterate our macro stance with the utmost gravity: The bear market is undeniably confirmed.
The current bounce, and the consolidation phase over the next two months, is absolutely not the start of a new bull run. It is the "halftime intermission" within a macro downtrend. This judgment is not based on sentiment, but on a rigorous seven-dimensional analytical framework.
3.1 The Ultimate Validation of the Wyckoff Distribution Model
One of our core market structure models—the Wyckoff Methodology—has completed its most critical phase. Let’s benchmark the current price action against the theoretical framework:
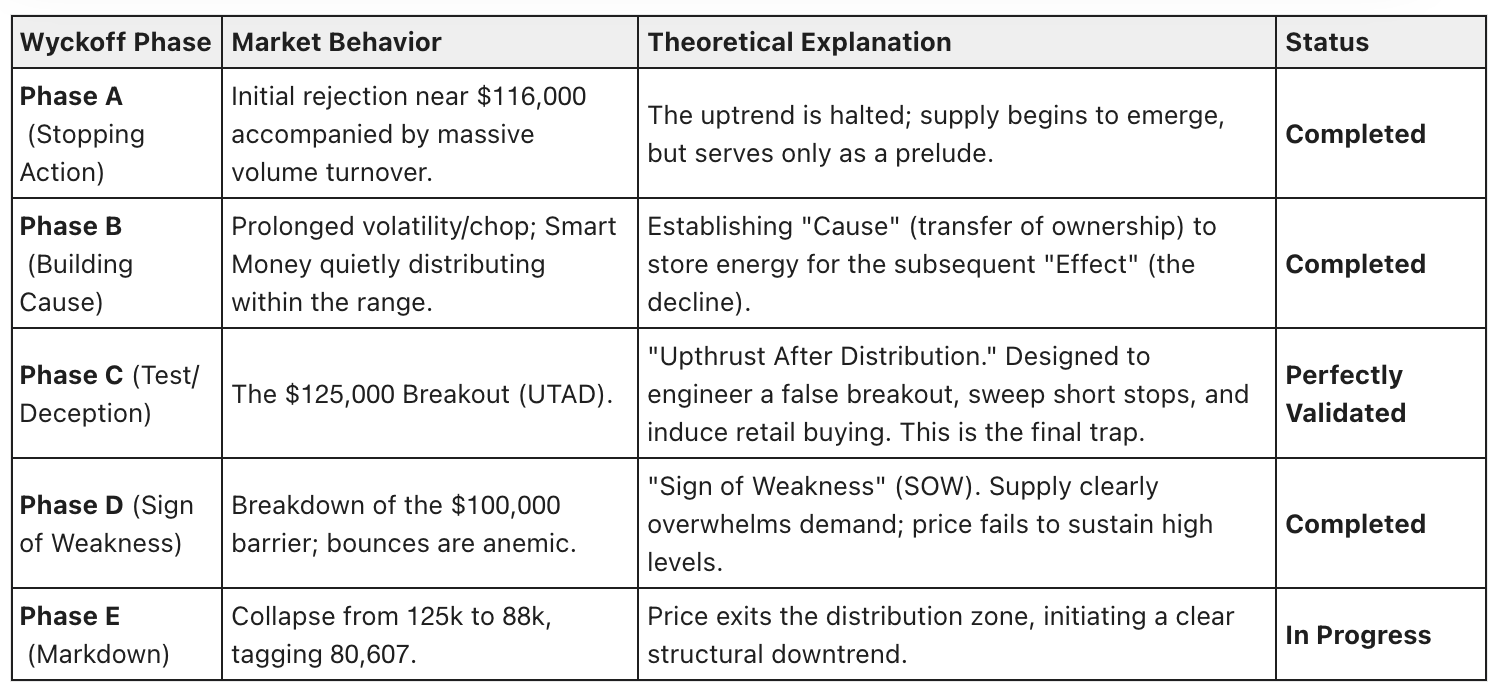
The market is currently in the early stages of Phase E. While Phase E represents the primary markdown, it is rarely a straight line. After a violent decline, the market typically enters a secondary Redistribution phase. This is precisely what we forecast for the next two months.
3.2 The Macroeconomic "Dovish Trap"
The market is awash with a naive narrative: "The Fed cut rates, so the bull market is back." This view is extremely dangerous. As we detailed in our Q4 Outlook, we must distinguish between two very different types of rate cuts.
Table 1: Rate Cut Characterization

The current rate cut is the Fed’s admission of economic weakness. It signals declining corporate earnings expectations and contracting risk appetite. Bitcoin, as a high-beta asset, has a correlation with the Nasdaq index as high as 70%. When traditional markets correct due to recession fears, Bitcoin cannot decouple. The belief that rate cuts equal an instant pump is a classic case of ignoring context.
3.3 The Iron Law of Time Cycles
Bitcoin's four-year cycle is not superstition; it is a physical constraint on supply and demand based on the halving mechanism. Historical data shows the average duration from cycle bottom to top is approximately 1450 days.
- 2013-2017 Cycle: 1467 days.
- 2017-2021 Cycle: 1428 days.
- Current Cycle: As of the $125,000 high, the time window is fully exhausted.
Time is the one dimension the market cannot fake. When the time window closes, the trend must reverse, regardless of how grand the narrative (ETFs, national reserves, etc.) may be. The bounce from $80,607 is just a ripple in the river of time; it cannot change the direction of the tide.
Chapter 4: The Consolidation Script—Scenario Planning for the Next Two Months' Meat Grinder
If the bear market is confirmed, why aren't we predicting a direct crash to $50,000? Why propose a strategy of consolidation and longing now? This touches on the most fascinating part of market microstructure game theory—Redistribution.
4.1 Why Does the Market Need to Consolidate?
After a 44,000-point crash, the market is in a state of extreme fragmentation:
- Leverage Flush: Long leverage was decimated during the drop, temporarily removing the fuel for a unidirectional decline.
- Disposition Effect: This is a behavioral finance concept. A massive number of retail traders who bought above $100,000 are now deeply underwater. They won't sell at $80,000 because the loss is too painful to accept psychologically; they will hold on ("diamond hands"), fantasizing about a bounce to break even.
- Smart Money Demand: Smart money cannot offload large remaining positions at $80,000 because there is no buy-side liquidity. To complete distribution, operators must manufacture hope. They need to rally price back to a relatively high level (e.g., near $100,000) to induce retail into believing the correction is over and the bull run has restarted, using that retail buy liquidity to finalize their exit.
Therefore, the next two months (approx. 60 days) will be a phase of manufacturing volatility without manufacturing trend.
4.2 The Consolidation Zone
Based on liquidity distribution analysis, we have mapped the battlefield for the next two months:
- Range Low (Demand Zone): $80,000 - $82,000
Here lies the completed FVG fill and the bulls' line in the sand. Any touch of this zone will trigger value-buying algorithms. - Range High (Inducement Zone): $108,000 - $111,000
This is the ideal location for a bull trap. Once price breaks $108,000, market sentiment will instantly flip from fear to greed, and media will scream "new highs imminent." This is the prime moment for secondary distribution. - Mid-Pivot (Equilibrium): ~$95,000
This is the contested ground where bulls and bears will repeatedly clash, and the zone most prone to two-way chops.
4.3 The Magnetic Effect: The Upper FVG
Just as the 80k FVG attracted the drop, the upper FVG will now attract the bounce. Between $92,000 and $96,000, there exists a massive sell-side liquidity gap left during the crash.
The market seeks symmetry. Since the lower gap is filled, the probability of tagging the upper gap is high. This provides the mathematical basis for our upcoming long strategy.
Chapter 5: How to Survive "Hell Mode"
I must issue a psychological risk warning to everyone reading this. The consolidation phase is a graveyard for traders; its destructive power far surpasses a one-way decline.
5.1 Abandon Trend Dogma
For the past two or three years of the bull market, many were conditioned: "Buy the dip, hold, and it will eventually hit a new high." This strategy is lethal for the next two months.
- If you buy at the range low and hold, hoping for $150,000, you will watch your profits evaporate after price hits the range high and reverses, potentially turning into a loss.
- If you chase the breakout at the range high, attempting to ride a new high, you will be left holding the bag at the peak and endure a long, agonizing decline.
5.2 Beware of Over-Trading
The greatest enemy in the consolidation phase is boredom. When price chops around $90,000 for a week, traders get anxious and hunt for signals on the 5-minute chart. This leads to over-trading and capital erosion.
Prism Insights' advice: Lower frequency, higher quality. Strike only at the structural extremes of the range; ignore the noise in the middle.
Chapter 6: Paid Core Content—Precision Tactics and Level Deployment
(The following content is exclusive to Origin Research paid members. This strategy is based on real-time order flow analysis and carries high timeliness and risk.)