
1. Control Structure, Not Probability
The crypto market has already moved beyond a simple one-directional trend. It has entered what we define as an intermediate phase—a complex, high-stakes game of structural manipulation.
As we accurately outlined in our previous report, $92,000 marked the key inflection point of this cycle. The short position we initiated at $92K has since proven to be the most effective shelter against the current market turbulence.
The defining characteristic of the current environment is structural transition and probabilistic ambiguity. The market is no longer offering clean “buy low, sell high” opportunities. Instead, it has evolved into a high-dimensional liquidity hunt.
Based on Prism Insights’ proprietary analytical framework—integrating Smart Money Concepts (SMC), Wyckoff methodology, and macro liquidity models—we believe the most rational strategy is not to over-trade every micro fluctuation, but to maintain the existing high-edge short position (entered at 92K, with partial profits already secured), remain patient, and allow structure—not emotion—to resolve.
2. The Strategic Importance of the 92K Short & the Nature of the Intermediate Phase
2.1 Shorting 92K: A Counter-Intuitive Left-Side Victory
The 92K short was not a gamble. It was a calculated response to a classic bull-trap distribution structure.
At the time, market sentiment was euphoric. Retail traders were overwhelmingly positioned for a breakout above $100,000. Yet Prism Insights’ models detected multiple signs of structural exhaustion:
- Completion of a liquidity huntPrice swept above prior highs near 94.5K, but failed to achieve a valid body close. This is textbook stop-loss harvesting. Large players used the breakout narrative to lure momentum traders and trigger short stops, sourcing liquidity to build sizable short exposure.
- Micro-structure breakdownOn the 1-hour chart, while higher-timeframe bias appeared bullish, internal structure was already printing lower highs. We explicitly highlighted that 92K aligned perfectly with the 4-hour Golden Pocket (0.618–0.66)—a structurally optimal short entry.
- The art of partial profit-takingEarly partial profit was not optional—it was critical. It locked in gains and converted the remaining position into effectively risk-free exposure. This profit cushion is precisely why we can now remain composed through rebounds, instead of reacting emotionally.
2.2 Defining the “Intermediate Phase”: From Trend to Chaos
We have repeatedly emphasized that the market is currently in Wyckoff Phase B—a prolonged testing and consolidation period following initial distribution and panic selling.
In this phase, market behavior changes fundamentally:
- Volatility compressionPrice oscillates violently within a ~$10,000 range.
- Deception intensifiesLogic tells you to sell rallies. Emotion panics you into chasing pumps. The market weaponizes fake breakouts and breakdowns to cleanse weak positioning.
- Liquidity thinsDecember brings holiday-mode trading desks, year-end performance constraints, and tax considerations. Thin liquidity allows relatively small capital flows to produce exaggerated price moves.
In this environment, holding outperforms trading. Constant position flipping only increases friction and psychological wear. A structurally sound short near the highs provides a god-mode vantage point over the battlefield.
3. Three Forward Scenarios & Their Probability Distribution
What follows is not chart reading—it is a behavioral and liquidity-driven dissection of market intent.
(Detailed breakdown below is available to subscribers.)
3.1 Scenario One: Deep Liquidity Sweep & Trend Continuation (Probability: 50%)
Core Thesis:
Price sweeps liquidity below $83,755, completes structural rebalancing, then rebounds.
This is Prism Insights’ base case and the ultimate target of the 92K short.
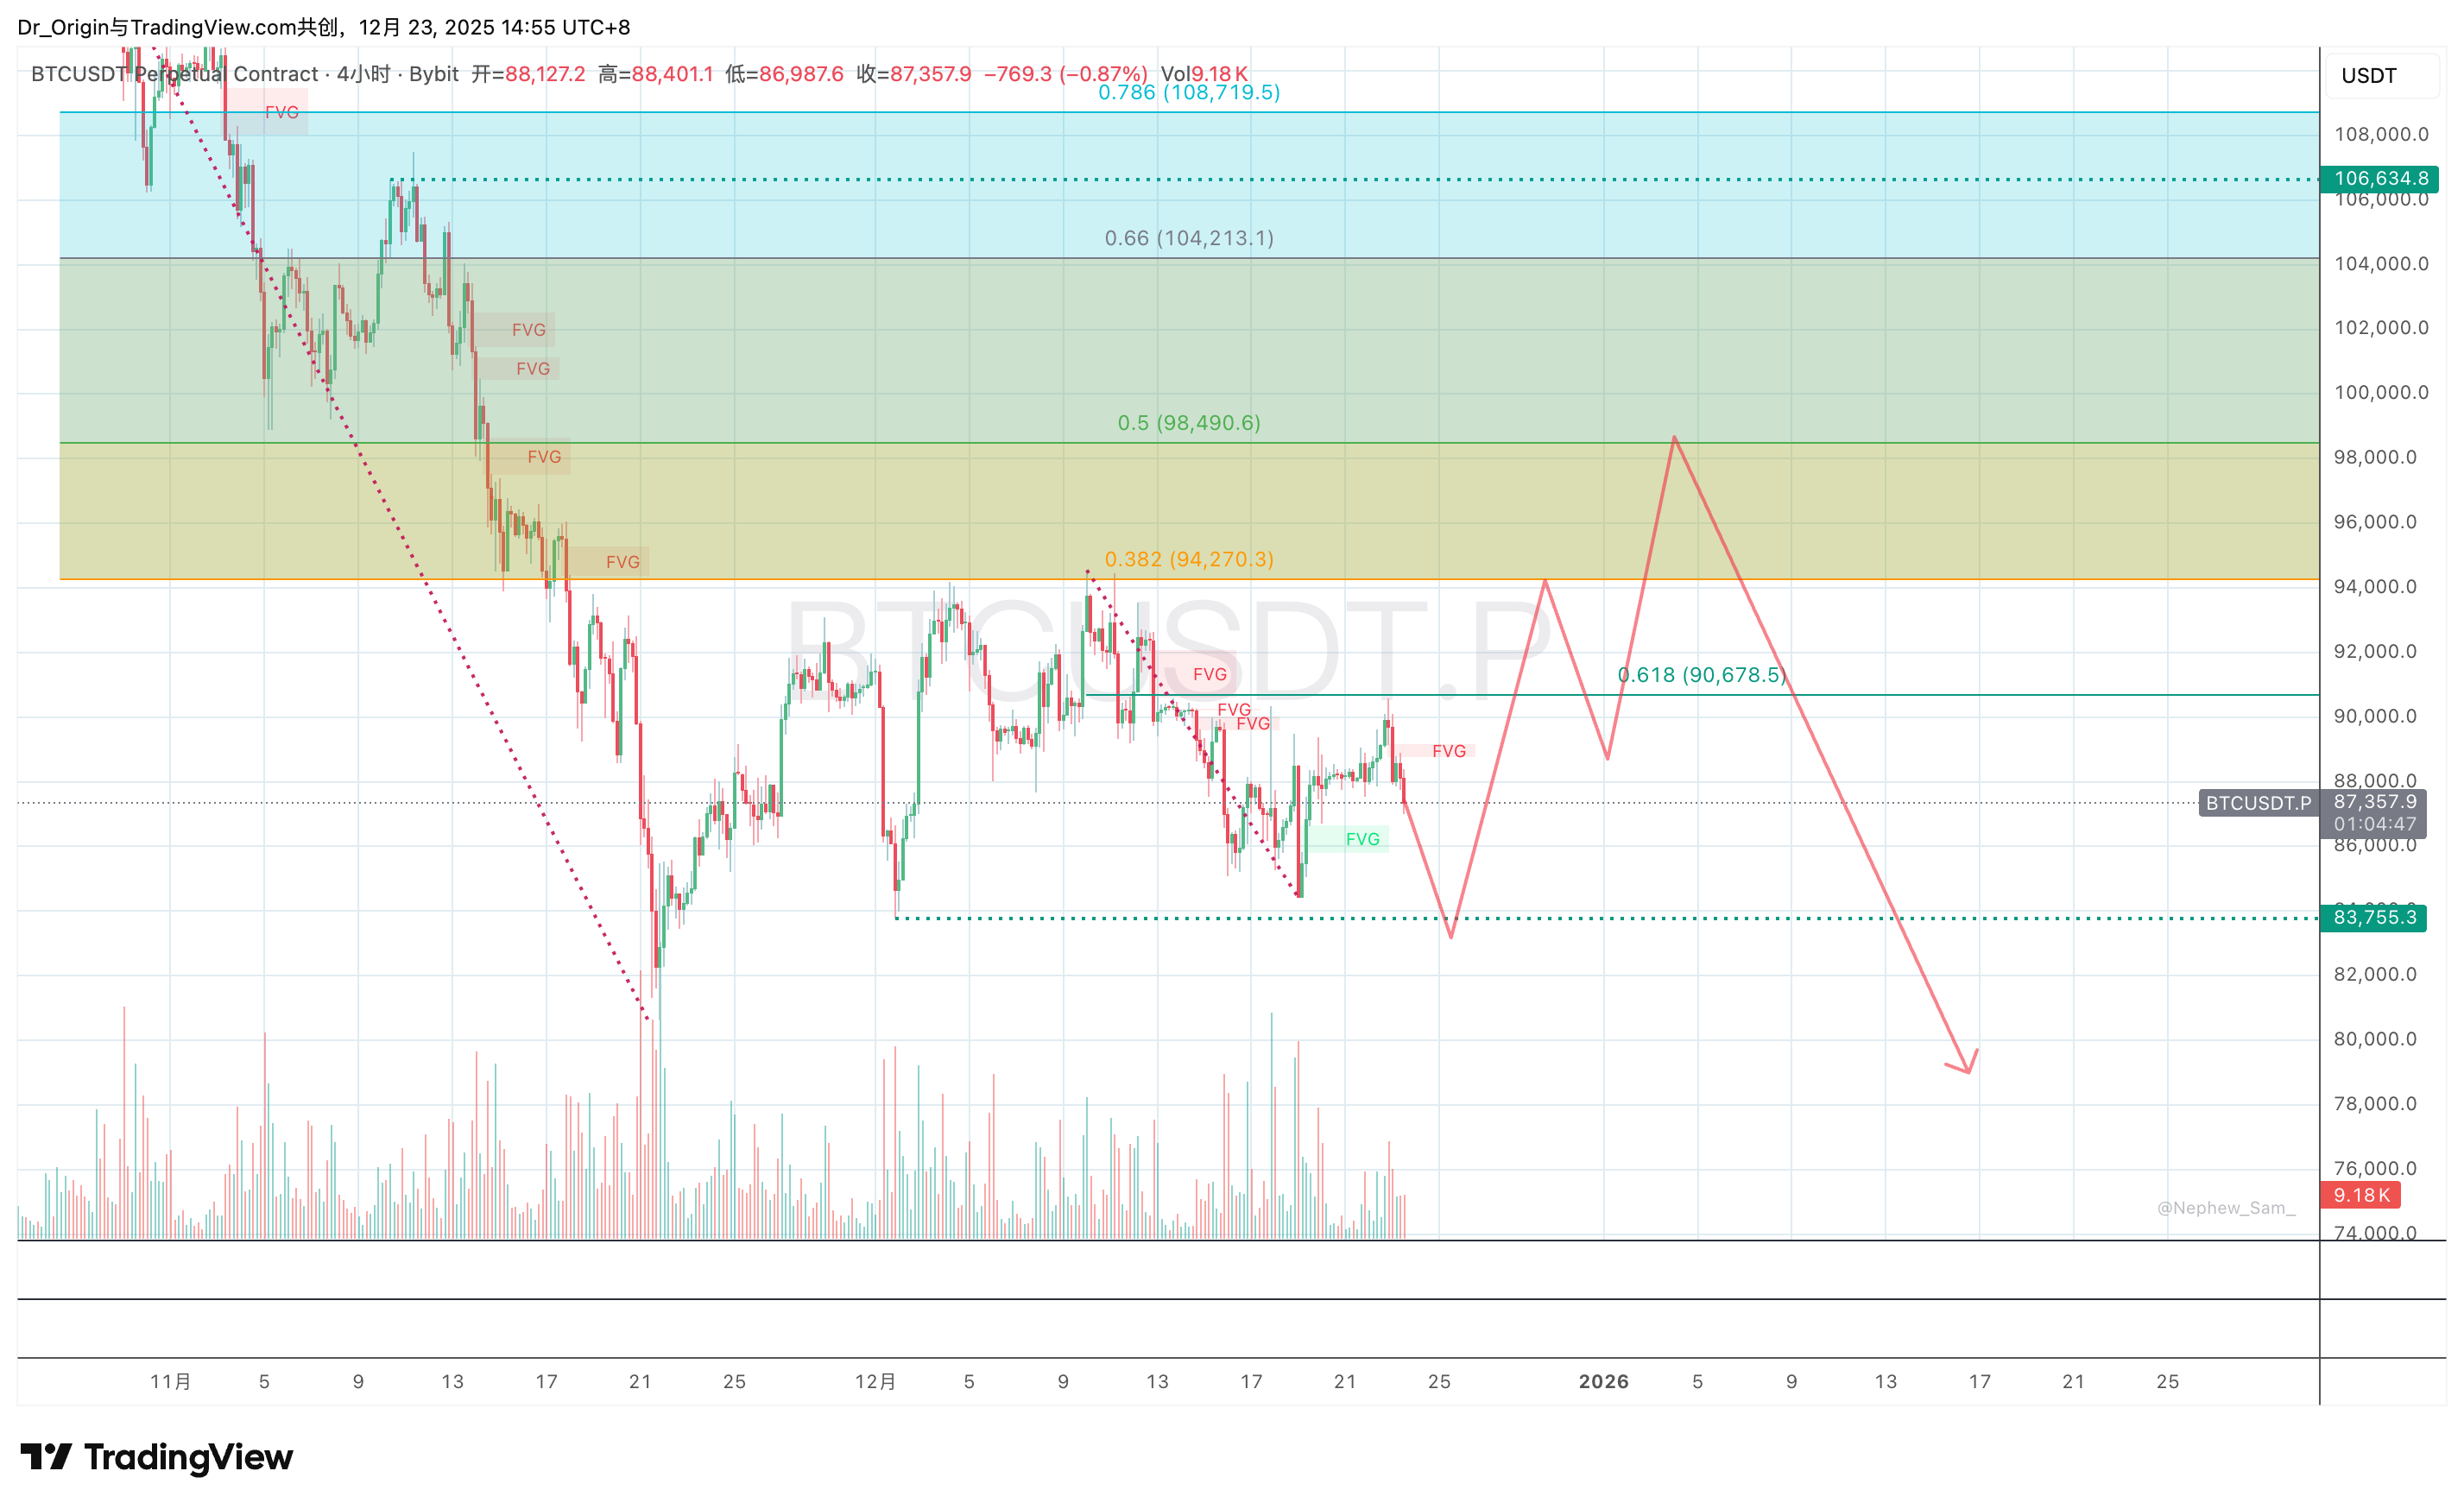
3.1.1 Technical Rationale: FVGs & Liquidity Pools
- Unfinished businessThe violent expansion from 80.6K → 93K left a large inefficiency. A 4-hour Fair Value Gap (FVG) remains open between $82,000–$83,500. Markets have an inherent mean-reversion tendency to rebalance such voids.
- Liquidity concentrationA dense cluster of stop-losses sits below $83,755—primarily from early longs. For market makers, these stops provide ideal fuel to close high-level shorts and re-accumulate long exposure. Without clearing this zone, a clean exit is unlikely.
3.1.2 Institutional Behavior Logic
This scenario aligns with the Maximum Pain Principle.
Large numbers of traders bought dips around 90K and 87K, betting on a “Santa rally.” A direct rally rewards them—an outcome institutions typically avoid. Instead, a breakdown below 87K triggers fear-driven capitulation. A sweep below 83.7K breaks the final conviction longs.
Only after despair peaks does a real reversal begin.
3.1.3 Execution Strategy
- Position: Maintain the 92K short
- Add-on zone: If price retraces into $94,200–$94,800 and shows 15-minute rejection signals, tactical short adds are valid
3.2 Scenario Two: Complex Consolidation & Ongoing Liquidity Extraction (Probability: 40%)
Core Thesis:
The 4.6% dump on Dec 19 completed the first hunt. Price now ranges, retesting below 87,580 before resolving.
This is a time-based correction—psychologically draining but structurally consistent.
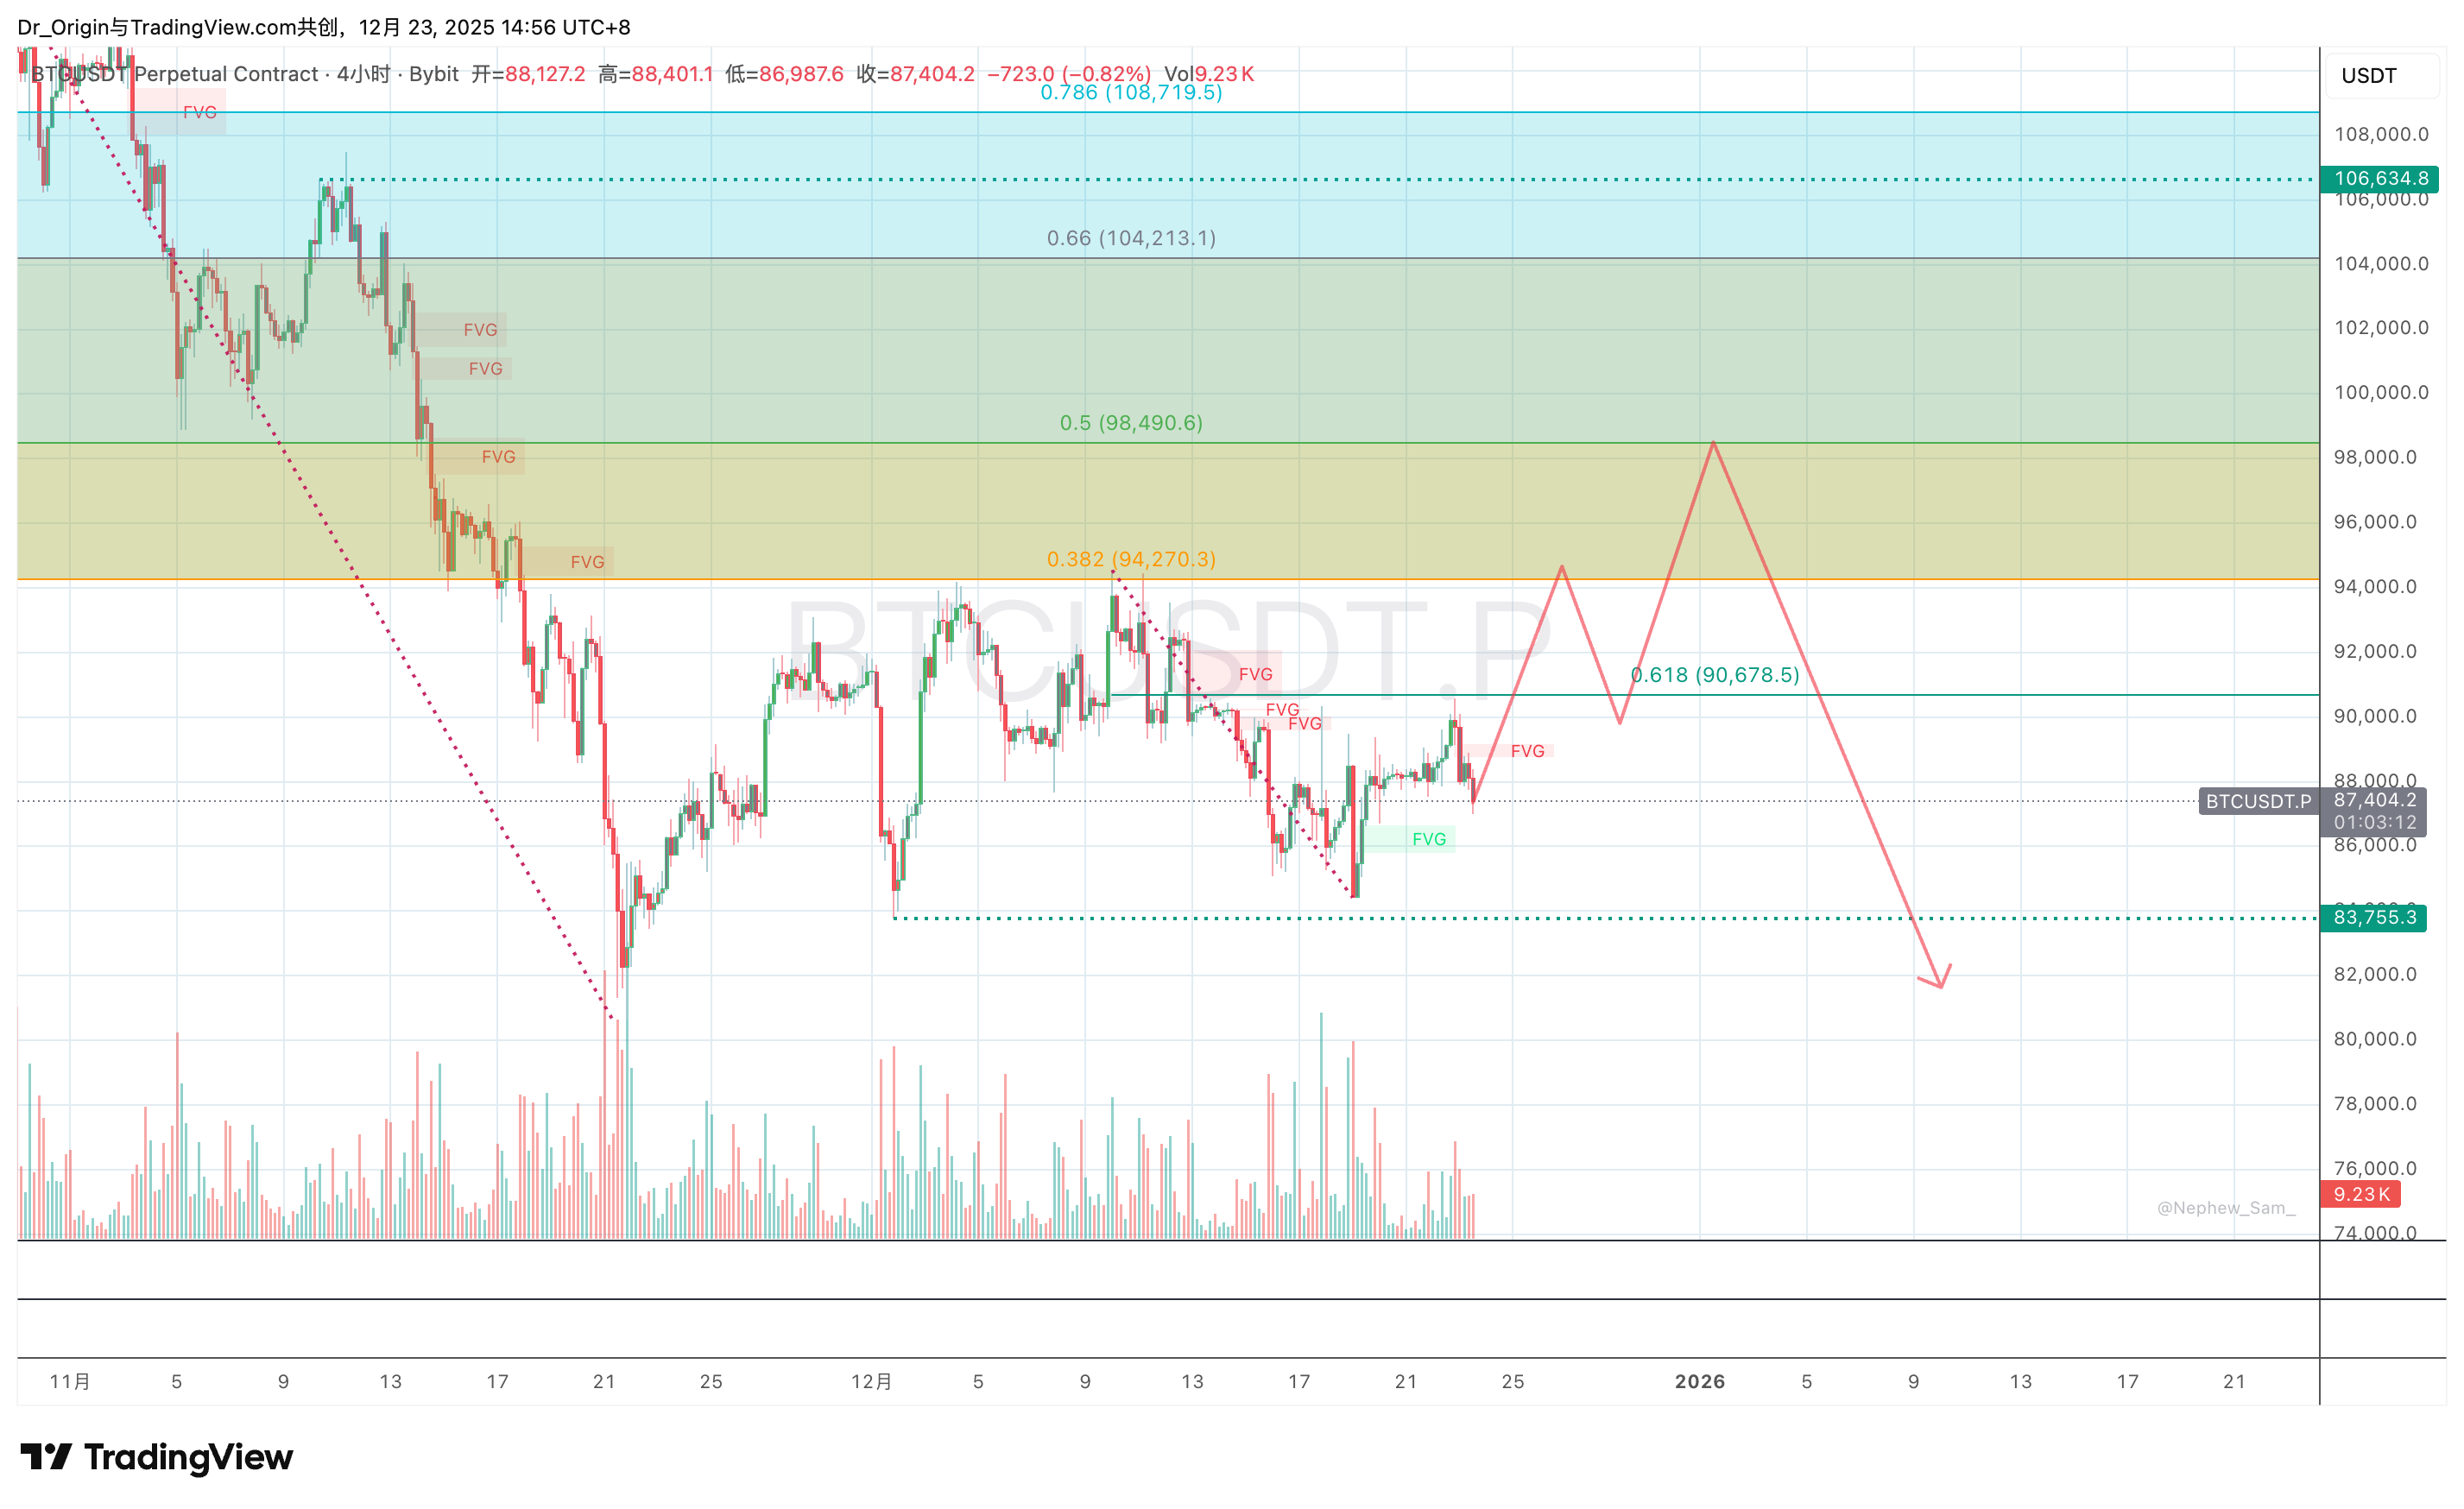
3.2.1 Technical Structure: Golden Pocket Compression
- The rebound stalled precisely at the 0.618 Fibonacci retracement of the 94K → 84.4K decline.
- Expect algorithm-driven whipsaws: false breakdowns below 87,580, panic-induced short chasing, followed by sharp reversals—a classic failed swing pattern.
3.2.2 Institutional Logic
Year-end liquidity constraints may prevent a full push to 82K. Instead, institutions harvest liquidity repeatedly within a narrower band.
For our position, this reinforces the value of partial profits. Even if price revisits entry, realized gains give us the flexibility to reload shorts calmly at higher levels.
This scenario demands patience and emotional discipline.
3.3 Scenario Three: Bull Trap Collapse & Immediate Sell-Off (Probability: 10%)
Core Thesis:
Price rejects at 0.618 and collapses immediately.
3.3.1 Why Only 10%?
A direct breakdown implies distribution is already complete. Given recent thin liquidity, this is statistically less likely.
Why “Left-Brain vs Right-Brain Trading” Is Dangerous
This mental conflict defines retail failure in range-bound markets.
- Left brain (logic): Death crosses, divergences, bearish indicators → “Short.”
- Right brain (emotion): Sudden +$500 spike → FOMO; profit drawdown → panic exit.
The market is engineered to exploit this loop. HFT systems generate millisecond spikes to trigger dopamine responses.
Prism Insights’ directive:Cut the feedback loop.
With a structurally superior 92K base position and profits secured, remaining exposure should be managed by structure, not emotion.
4. Finding Order in Chaos
This report is not merely a price forecast—it is a survival framework for the intermediate phase.
The three scenarios are simply different liquidity paths toward the same objective: shaking out weak hands and completing ownership transfer.
As a Prism Insights subscriber, your greatest edge is positioning.
A partially realized 92K short hangs over the market like a Sword of Damocles. Ignore the noise. Do not chase every tick. Instead of exhausting yourself in emotional over-trading, emulate the predator—still, patient, and lethal—waiting for price to step into the trap.
Markets change endlessly.
Structure is eternal.
Continue to observe.
Disclaimer
This report reflects the views of the Prism Insights analysis team and is believed to be reliable at the time of publication, but accuracy and completeness are not guaranteed. Cryptocurrency markets are highly volatile and involve significant risk, including leverage risk. This report does not constitute investment advice, financial advice, or a solicitation to trade. Investors must make independent decisions based on their own risk tolerance and execute strict risk management. Prism Insights assumes no responsibility for any direct or indirect losses resulting from the use of this report.