
1. Liquidity Warfare and Precision Trend Capture
In a market defined by extreme volatility, the ability to filter signal from noise is what separates professional operators from reactive participants. Once again, Prism Insights’ analytical framework has been validated in real time.
Over the past month, our positioning followed a clear and disciplined logic. As Bitcoin completed its structural decline and printed a major low at $80,500, we identified unmistakable accumulation behavior. Members were guided to capture the first rebound leg between $83K and $94K, a move that has now been fully realized.
Subsequently, as market sentiment shifted aggressively bullish and FOMO narratives around a breakout above $100,000 reached saturation, Prism Insights took the opposite side. Based on clear signs of microstructural degradation, we issued decisive guidance:
- Hedge or take profit on longs near $92.5K
- Initiate naked short exposure around $92K
At the time of writing, this contrarian, left-side positioning is deep in profit. Price action has unfolded exactly as projected, with the market now engaged in a ruthless hunt for downside liquidity.
This report is structured in two parts:
- Part One (Public Review):A detailed breakdown of the multi-layered logic behind the $92K short, including daily inside-bar structure, 4H Golden Pocket rejection, and micro-order-flow anomalies. This section demonstrates how institutional traders capture fleeting windows without relying on rigid assumptions.
- Part Two (Members-Only Deep Dive):An exclusive forward projection of Bitcoin’s terminal downside script. Why the current move is merely the opening act—and how to execute a high-conviction counter-trend long at peak panic.
The market is undergoing a meticulously engineered transfer of inventory. For institutions, every deep squat is preparation for a higher jump. For retail participants, misreading liquidity traps turns every “dip buy” into a falling knife.
This report is designed to give you X-ray vision into the market’s true mechanics—so you stand with the hunters, not the hunted.
2. Public Review: The $92K Short — Precision Execution and Tactical Reframing
Trading excellence is not about predicting the future. It is about identifying probability distributions in real time and optimizing risk-reward with discipline.
The short positioning initiated by Prism Insights near $92K was not a gamble. It was a rational decision driven by multi-timeframe confluence.
2.1 The End of the $83K–$94K Rebound: Detecting Momentum Exhaustion
Following the $80.5K low, Bitcoin staged a seemingly strong rebound. Throughout this phase, Prism Insights maintained a bullish bias, as the market continued to print higher highs and higher lows. As long as price held above $80.5K, we classified the structure as Wyckoff Phase B—a consolidation preparing for eventual distribution.
However, danger signals emerged near $94,500.
Price failed to reach its intended upside target and was immediately rejected by heavy supply. In technical terms, this is a classic sign of weakness, revealing two critical dynamics:
- Heavy Spot Supply:Above $94K sat a dense cluster of trapped inventory from prior distribution, combined with institutional balance-sheet-driven supply.
- Buyer Exhaustion:Despite expanding volume, candle bodies compressed and upper wicks elongated. Every marginal bid was absorbed by stronger sell orders.
As price rotated back toward $92.5K, we advised hedging half of long exposure. On the second test of $92.5K, we recommended fully closing longs or flipping short—locking in profits just ahead of structural deterioration.
2.2 Abandoning Assumptions: Why We Shorted Aggressively at $92K
In our strategy update “Abandon Assumptions — Reconstructing the $92K Trade”, Prism Insights documented a critical tactical shift that defines professional adaptability.
2.2.1 The Failure of the Original Script
Our initial plan followed classical Dow Theory confirmation:
- Wait for a break below $87,700 (the prior 4H higher low)
- Confirm a lower low
- Short the rebound into $92K
This was a conservative, right-side strategy.
The market denied that setup.
Bitcoin found support near $89,400, never reached $87.7K, and instead rebounded directly into the $92K–$92.5K short zone—briefly spiking above $93K.
At this moment, market participants faced paralysis:
- Rule-bound traders refused to short without confirmation.
- Momentum chasers mistook $89.4K for a durable bottom and chased longs into $92K.
Prism Insights chose a third path:
We abandoned the requirement for a prior breakdown and shorted directly at $92K.
2.2.2 The Three Pillars Supporting the $92K Short
This decision was grounded in a powerful three-layer technical resonance.
1. Daily Inside-Bar (Harami) Structure
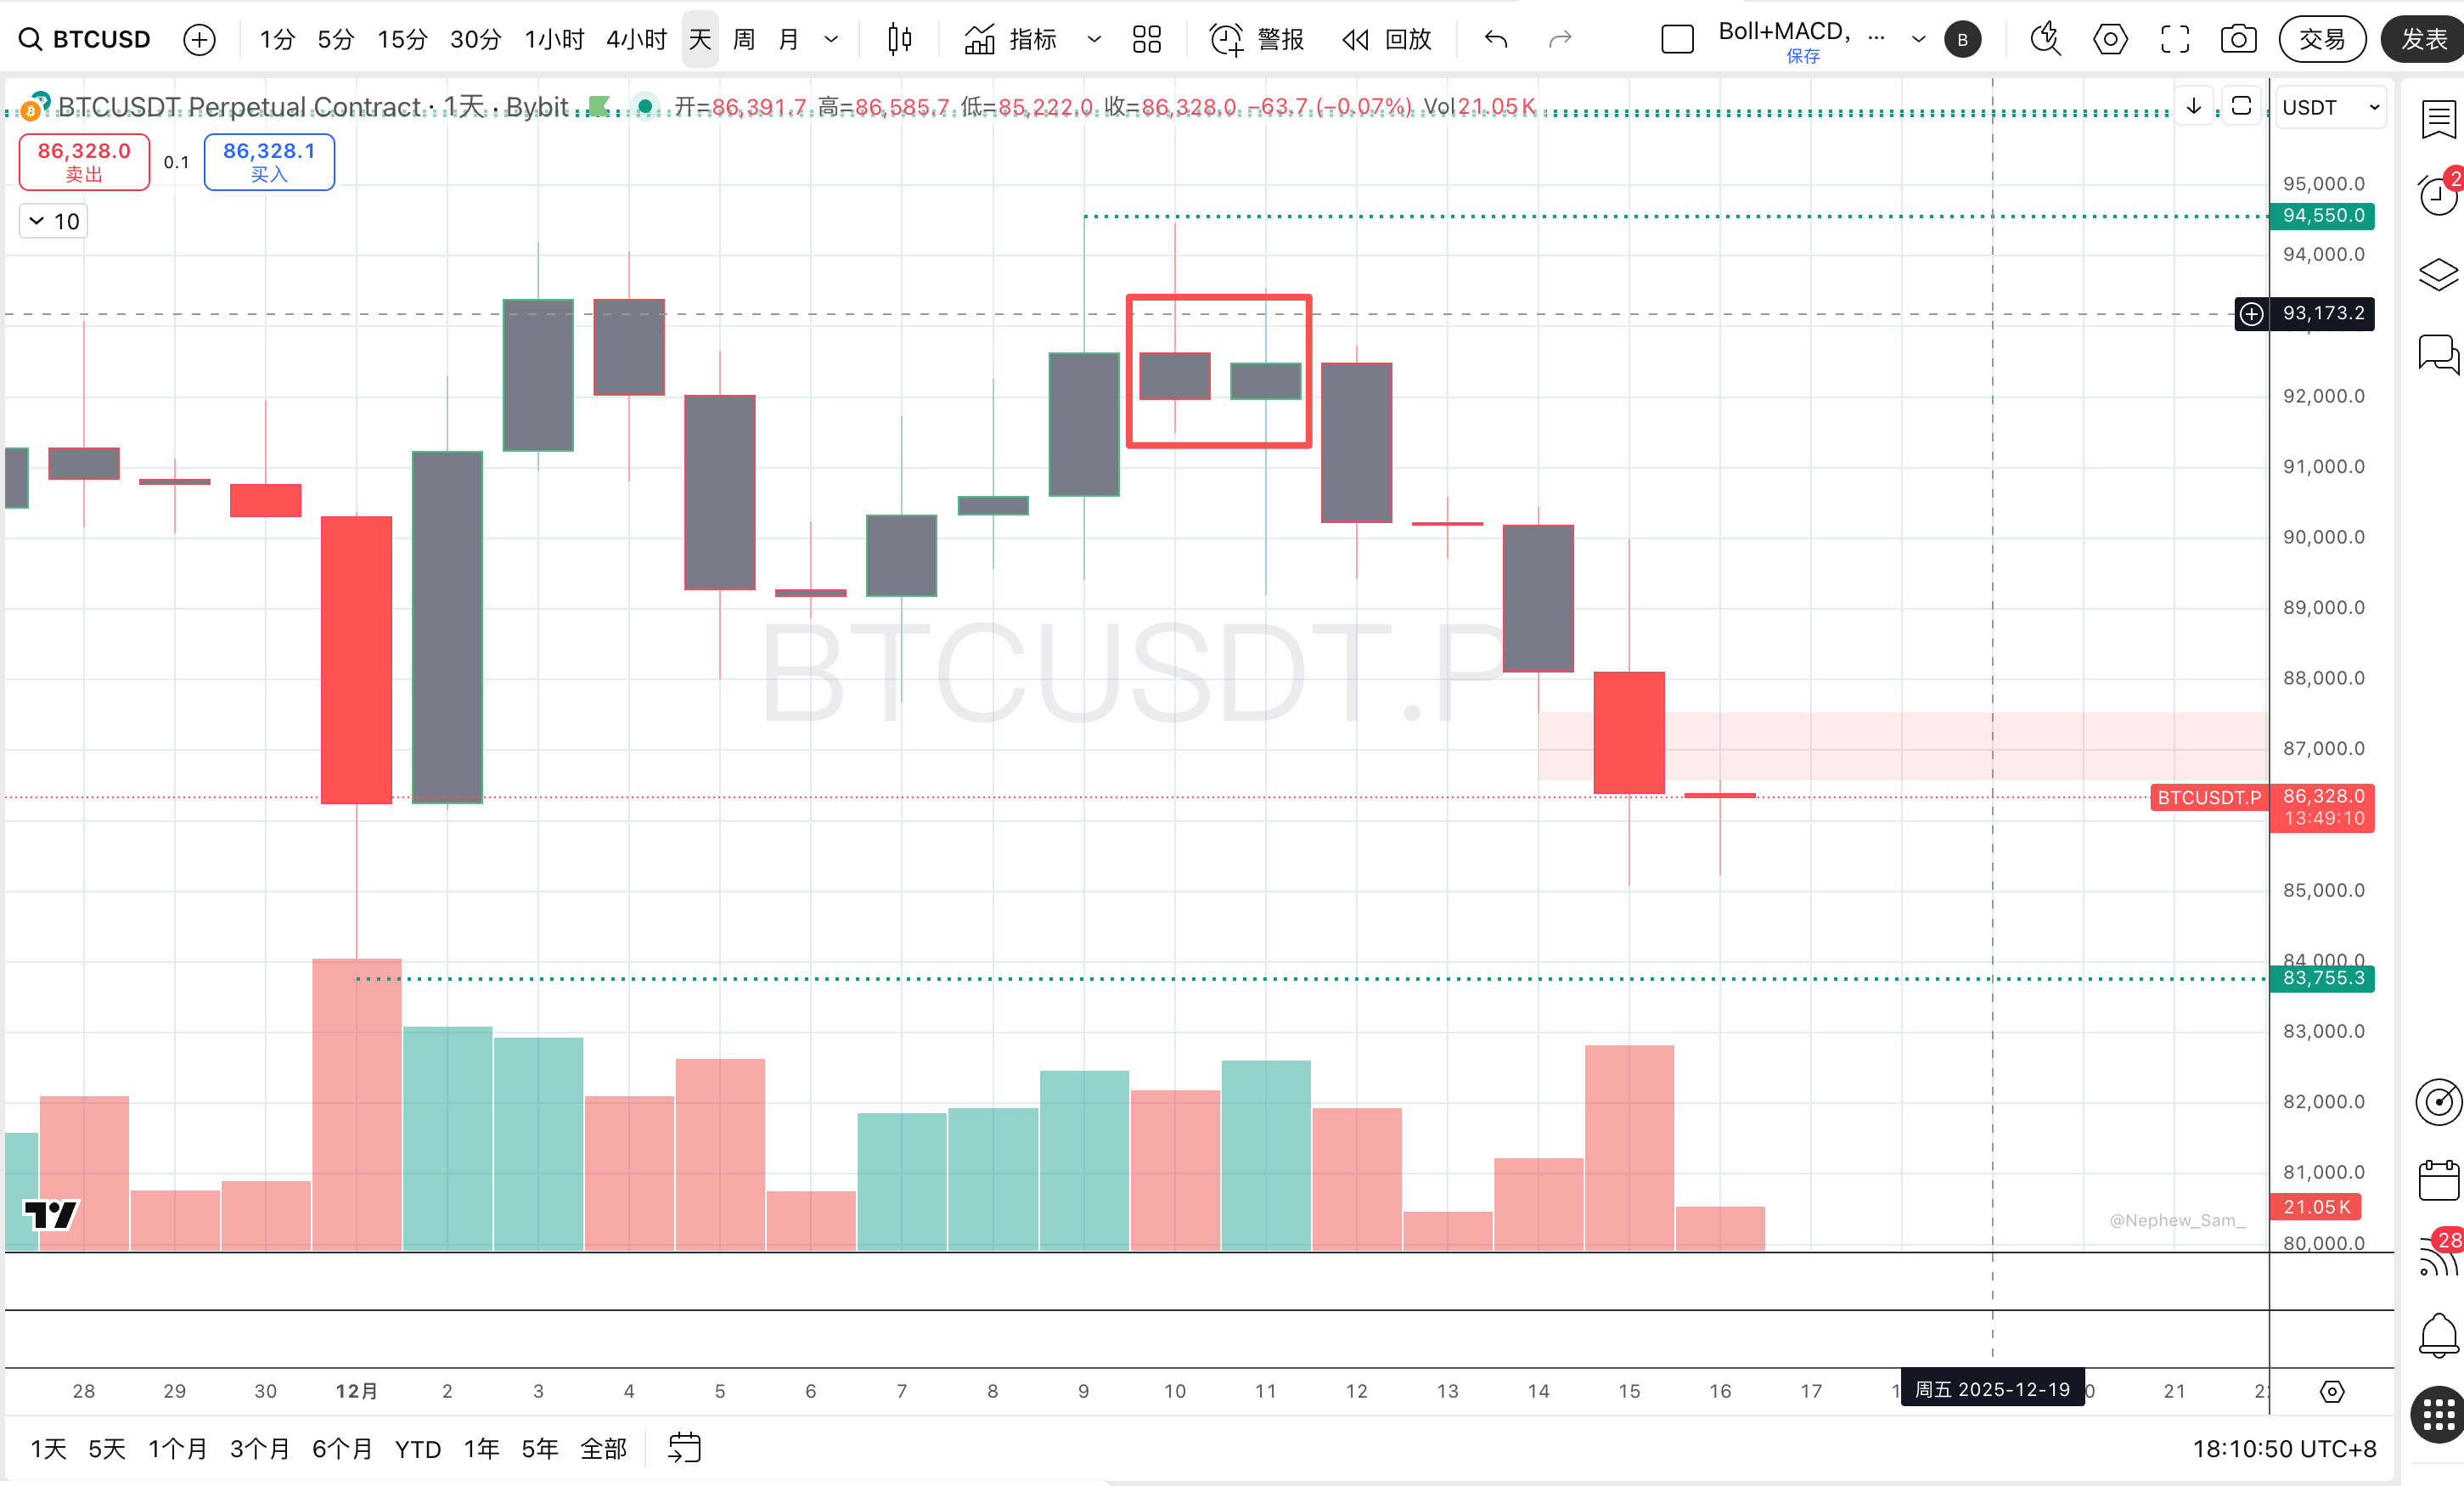
The December 11 daily candle was fully contained within the large bearish candle of December 10, forming a classic inside bar.
- Market Psychology:Inside bars signal hesitation and volatility compression following impulsive movement. In this context, it represented bearish continuation, not reversal.
- Execution Logic:As long as price failed to reclaim the mother candle’s high near $94.5K, the consolidation remained corrective. This gave us daily-level safety to engage shorts near $92K.
2. 4H Golden Pocket Rejection
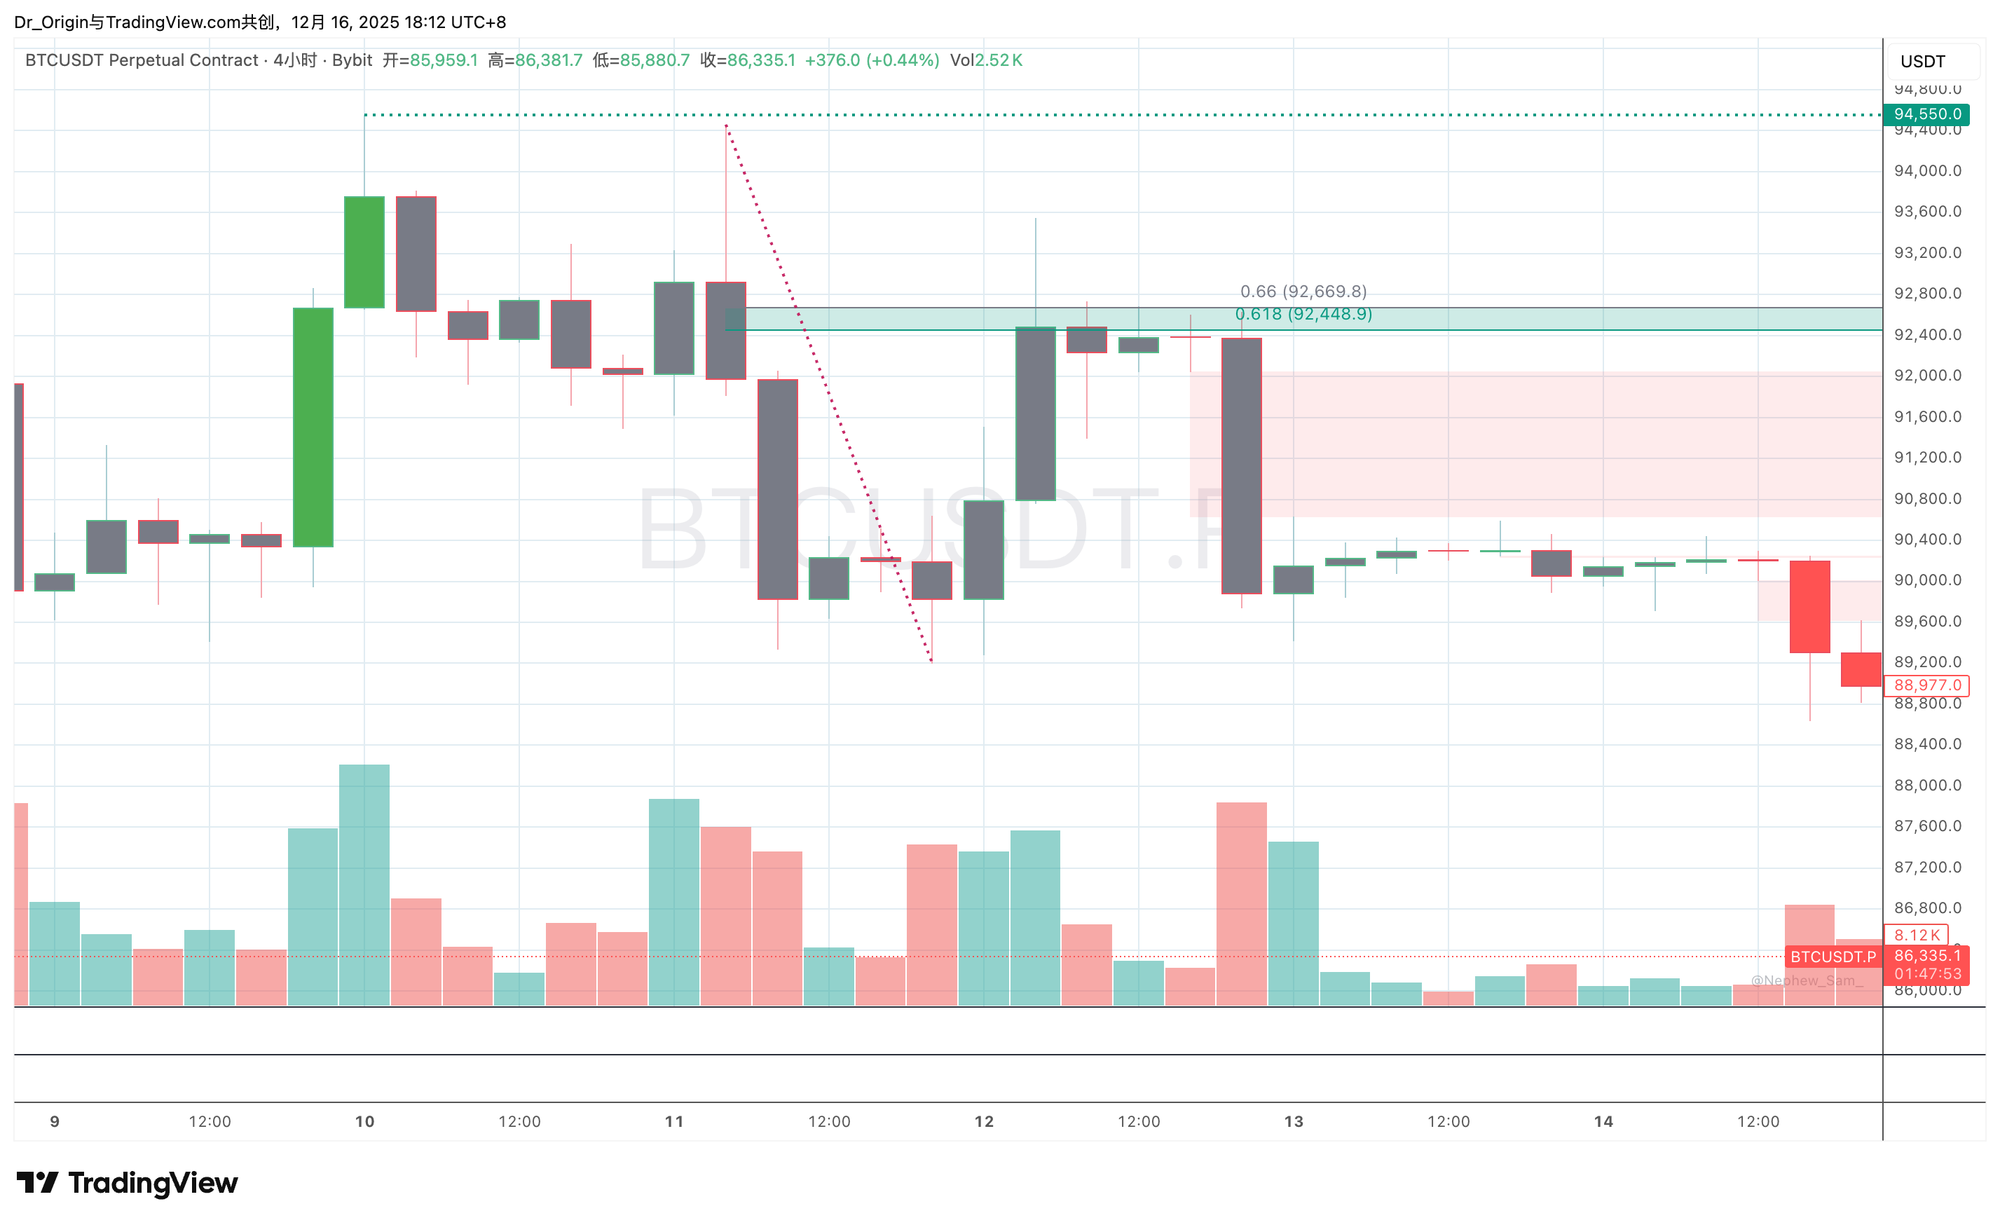
On the 4-hour chart, Fibonacci retracement measured the rebound from $89.4K.
Price stalled precisely at the 0.618–0.66 Golden Pocket of the $94.5K → $89.4K decline.
- Institutional Context:The Golden Pocket is a preferred reversal zone for algorithms and market makers.
- SMC Interpretation:No 4H candle body managed to close above 0.618. A retracement that fails here is structurally a lower high, signaling exhausted bullish momentum.
3. 1H Micro-Structure Breakdown
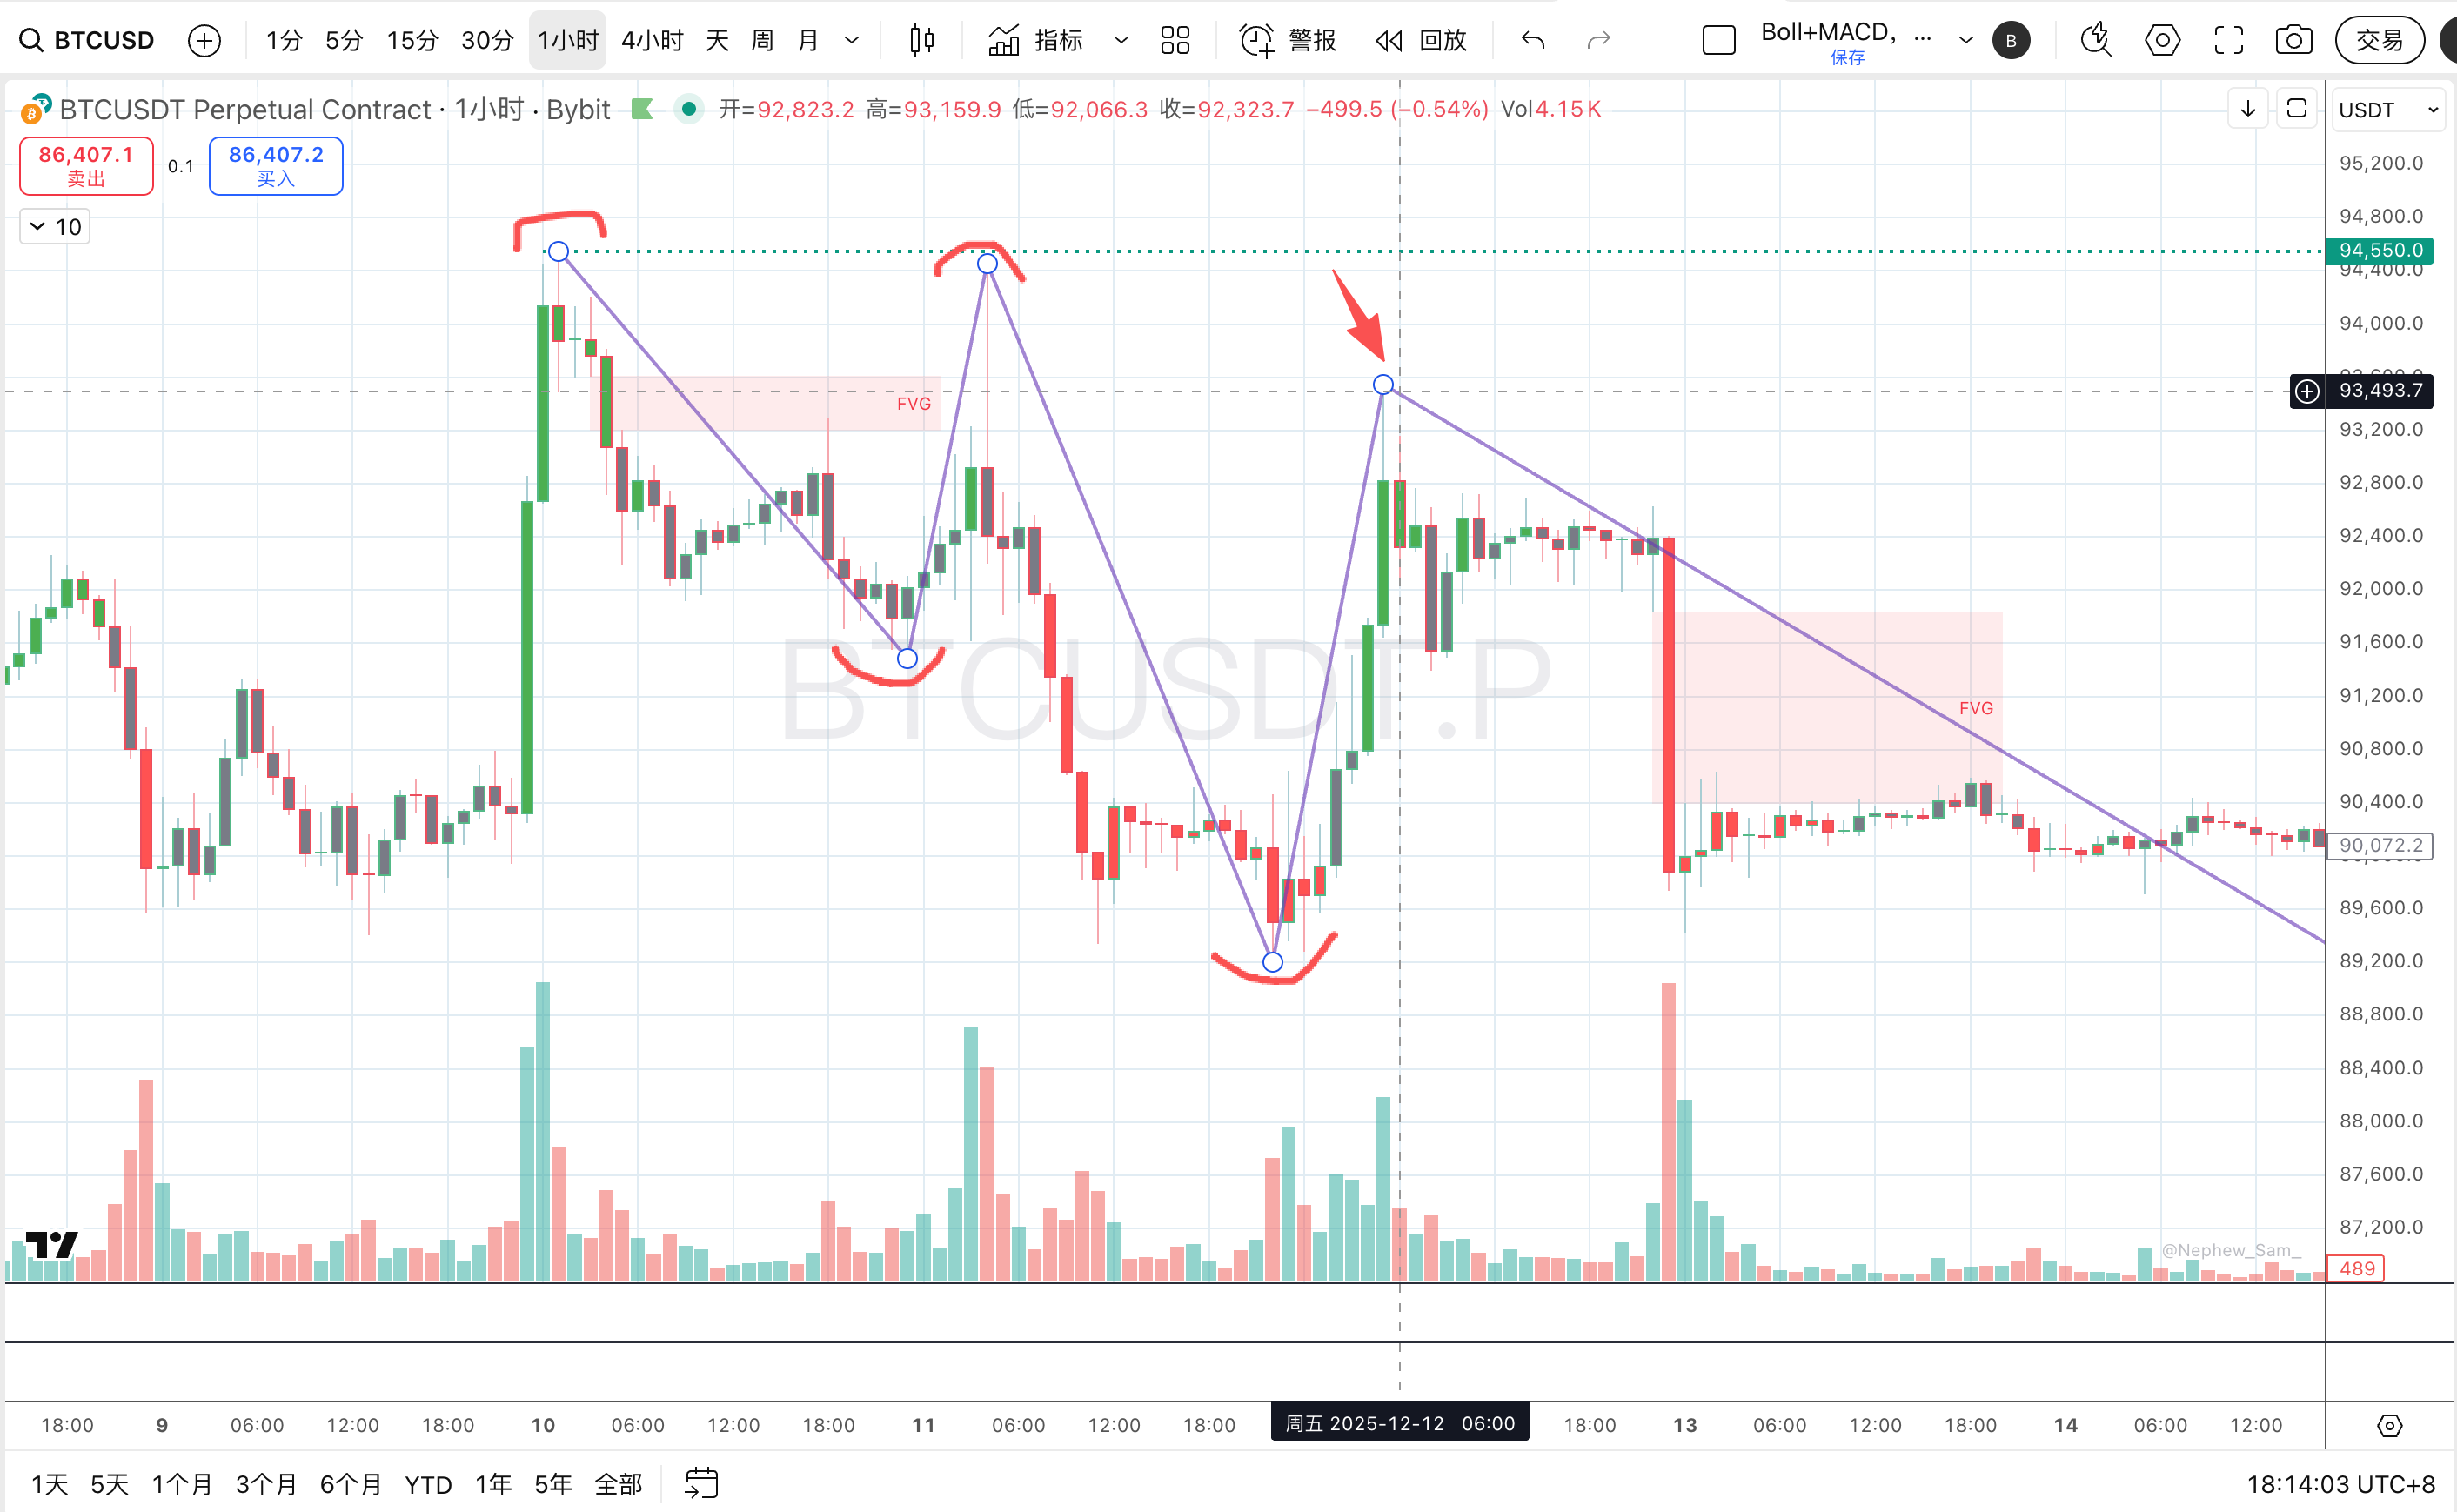
On the 1-hour timeframe, $92K began forming a distribution top.
While macro structure had not yet broken, internal structure showed clear stalling and rotation. For aggressive traders focused on asymmetric R:R, this emerging lower high provided sufficient justification to act without waiting for delayed confirmation.
3. Deep Projection: The Ultimate Downside Script
As unrealized profits on the $92K short expand, the key question shifts from whether to short to how long to hold—and where the next major long opportunity will emerge.
(The following section reflects Prism Insights members-only forward modeling and execution planning.)