
1. Separating Signal from Noise
The Bitcoin market is currently embedded in a highly deceptive and structurally complex phase, characterized by sharp short-term volatility.
Markets always move along the path of least resistance. At this stage, that path is defined by liquidity-driven leverage cleansing, not fundamentals.
Price action has now reached a critical inflection point. Bitcoin has decisively broken below $89,400, a key short-term structural support. This is a dangerous yet exceptionally clear signal.
In our assessment, all widely cited bullish narratives—rate cut expectations, institutional inflows, and macro optimism—have already been fully priced in. Over the coming sessions, particularly during a thin-liquidity holiday trading window, price will no longer be driven by fundamentals. Instead, order flow dynamics and liquidity distribution will dictate direction.
In this report, we will precisely outline our updated price path projection and identify what we believe to be the highest-probability short-selling opportunity within the current structure.
2. The Rally from $80.5K: Structural Resilience and Target Reassessment
2.1 Trend Integrity: Our Long Bias Remained Valid Until Yesterday
It has been nearly three weeks since Bitcoin rebounded from the $80,500 low. Throughout this period, the market endured multiple aggressive shakeouts. However, when noise is stripped away and the structure is examined on the 4H and daily timeframes, the trend remained intact: higher highs and higher lows persisted.
For this reason, Prism Insights maintained its long exposure.
$80.5K was not merely a price level—it represented the logical origin point of the broader rebound–consolidation structure. As long as price oscillated constructively above this level, we interpreted the move as Wyckoff Phase B: a controlled volatility environment designed to prepare for eventual distribution.
At no point during this phase did we observe evidence of completed large-scale distribution.
2.2 The $94.5K Exhaustion: Failure to Reach Tactical Targets
In earlier reports, we outlined an ultimate consolidation target near $101K, with interim tactical objectives at $96K–$98K. However, markets are dynamic systems.
Price stalled at $94,500 and subsequently exhibited clear momentum exhaustion. In technical analysis, failure to reach a projected target before reversing is a hallmark of structural weakness.
This behavior indicates heavier-than-expected spot supply above $94K, likely originating from trapped high-timeframe holders and institutional hedge activity.
Volume expanded aggressively during the $94.5K test, yet price failed to break higher—a classic signal that sell-side pressure overwhelmed demand.
2.3 Prism Insights’ Tactical Hedge Execution
At $91,500, Prism Insights publicly instructed members to hedge 50% of long exposure.
At $92,500, we executed a full hedge, neutralizing all remaining long positions.
This decision was driven by microstructural signals: despite upward price movement, bid-side momentum was deteriorating, repeated upside attempts failed to hold, and distribution characteristics emerged.
By neutralizing exposure near the highs and establishing hedge shorts, our positioning remains comfortably insulated against the subsequent breakdown below $89.4K and the approaching $87.7K liquidity sweep. Capital was preserved, and downside exposure was monetized.
3. Post-$89.4K Breakdown: Market Psychology and Game Theory
3.1 Initial Long Liquidations Completed
The $89,400 level represented a dense cluster of retail long stop-losses formed during early-week consolidation. That level has now been decisively breached by a strong bearish impulse.
This breakdown altered the 1H market structure. Long defenses collapsed, and prior demand above $89.4K instantly converted into trapped supply.
3.2 Decision Point: Chase Shorts or Wait?
Market participants now face a psychological crossroads:
- Aggressive bears chase the breakdown.
- Stubborn bulls dismiss it as a false break and double down.
- Prism Insights does neither.
We view shorting at current levels as extremely dangerous. Below $89.4K lies the prior swing low at $87.7K, leaving insufficient room for favorable risk–reward.
More importantly, the absence of panic selling during the $89.4K break tells us this was not the point of maximum pain. Liquidity has not yet been fully harvested.
Price is therefore highly likely to push lower, targeting $87.7K.
4. Scenario Projection: Deeper Liquidity Extraction
(Charts and full visual projections are available exclusively to Prism Insights members.)
4.1 Why $87.7K Matters
Our core projection calls for a precise downside sweep through $87,700.
This level is structurally critical for two reasons:
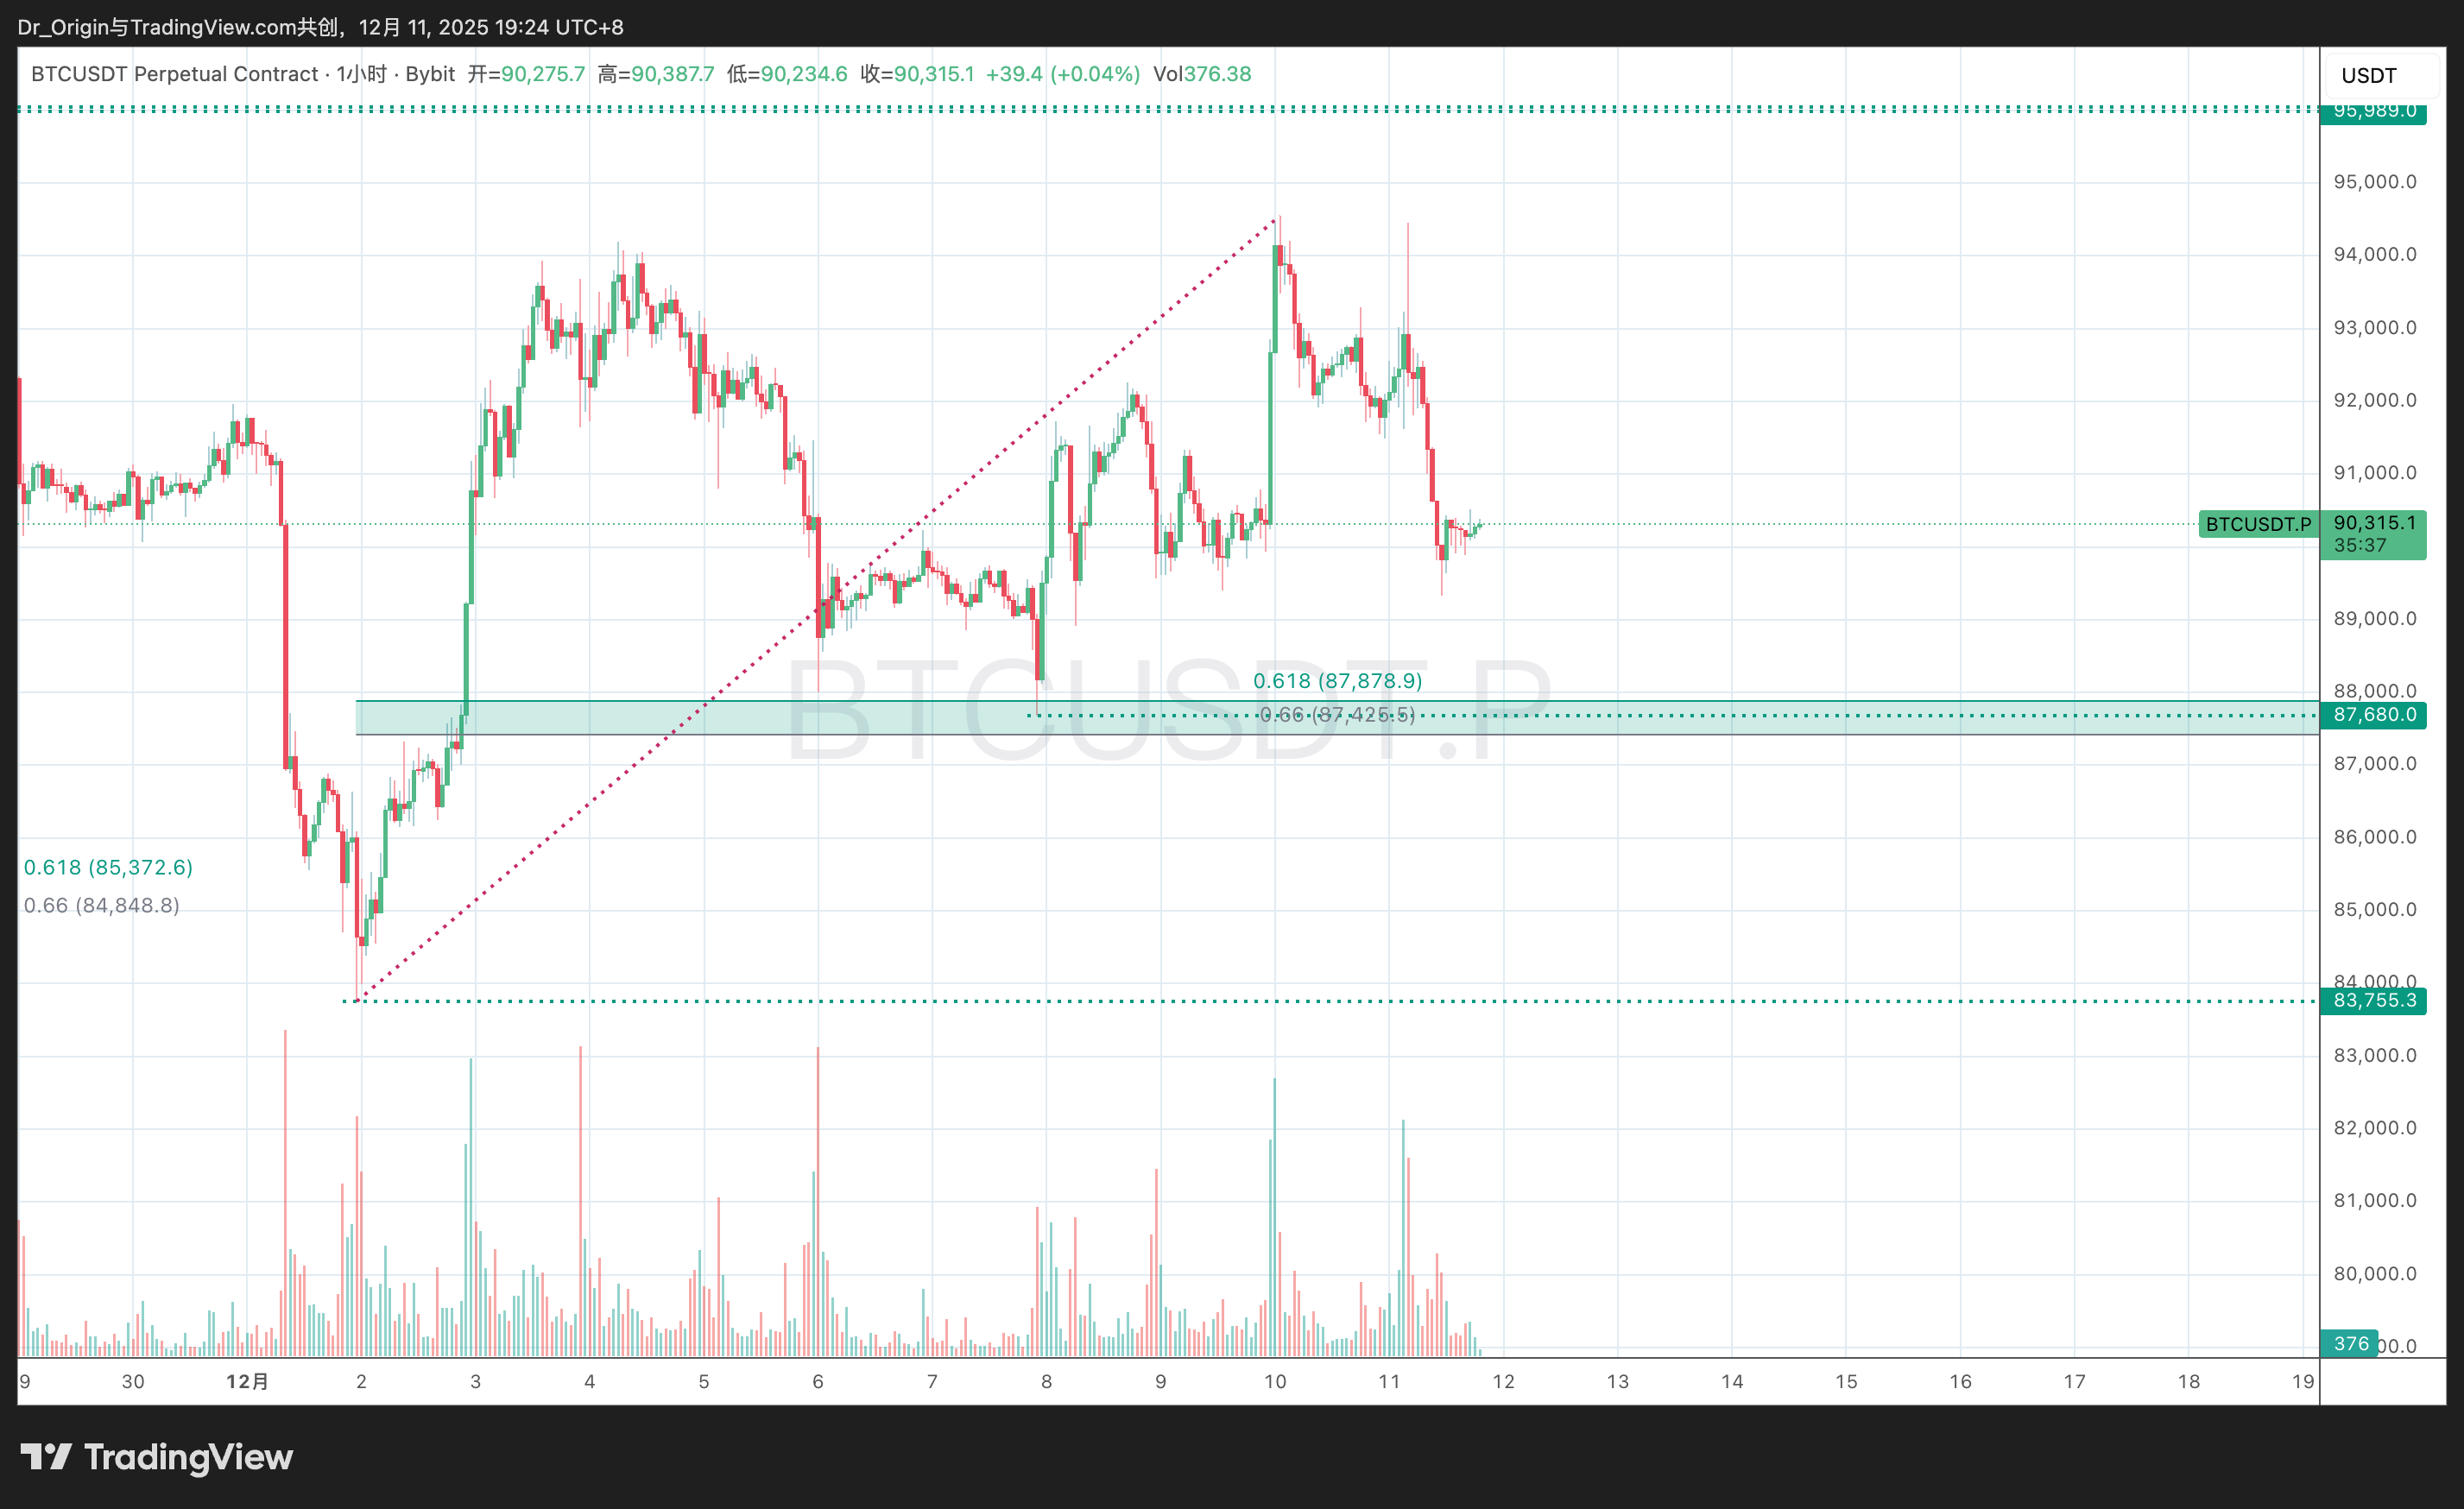
- Fibonacci Confluence: $87.7K aligns with the 0.618–0.66 golden pocket retracement of the advance from $83.7K.
- Stop-Loss Density: The majority of longs initiated between $89K–$93K will have protective stops below the prior swing low at $87.7K. For market makers, these stops represent necessary liquidity.
4.2 The Psychology of the Sweep
This move is fundamentally a psychological stress test.
In prior reports, we discussed the concept of intermittent reinforcement—markets repeatedly trained participants to buy dips by rapidly reversing selloffs. This time, the structure is different.
By breaking $89.4K and consolidating lower, the market is manufacturing a narrative shift: “the rebound is over.”
When price punctures $87.7K, panic will peak. Indicators will turn decisively bearish. Candlestick structures will deteriorate.
That moment is precisely when swing capital steps in to accumulate—they require capitulation, not comfort.
4.3 Projected Price Path
Our modeled sequence is as follows:

- Flush: Breakdown below $87.7K, potentially wicking toward $87.2K
- Stabilization: Liquidity harvested
- Rebound: Recovery toward $92K
5. Optimal Short Setup: The $92K Retest
5.1 Why $92K Is the Highest-Probability Short
If the projected flush–rebound scenario unfolds, $92,000 becomes the most attractive short entry in the current correction.
Confluence factors:
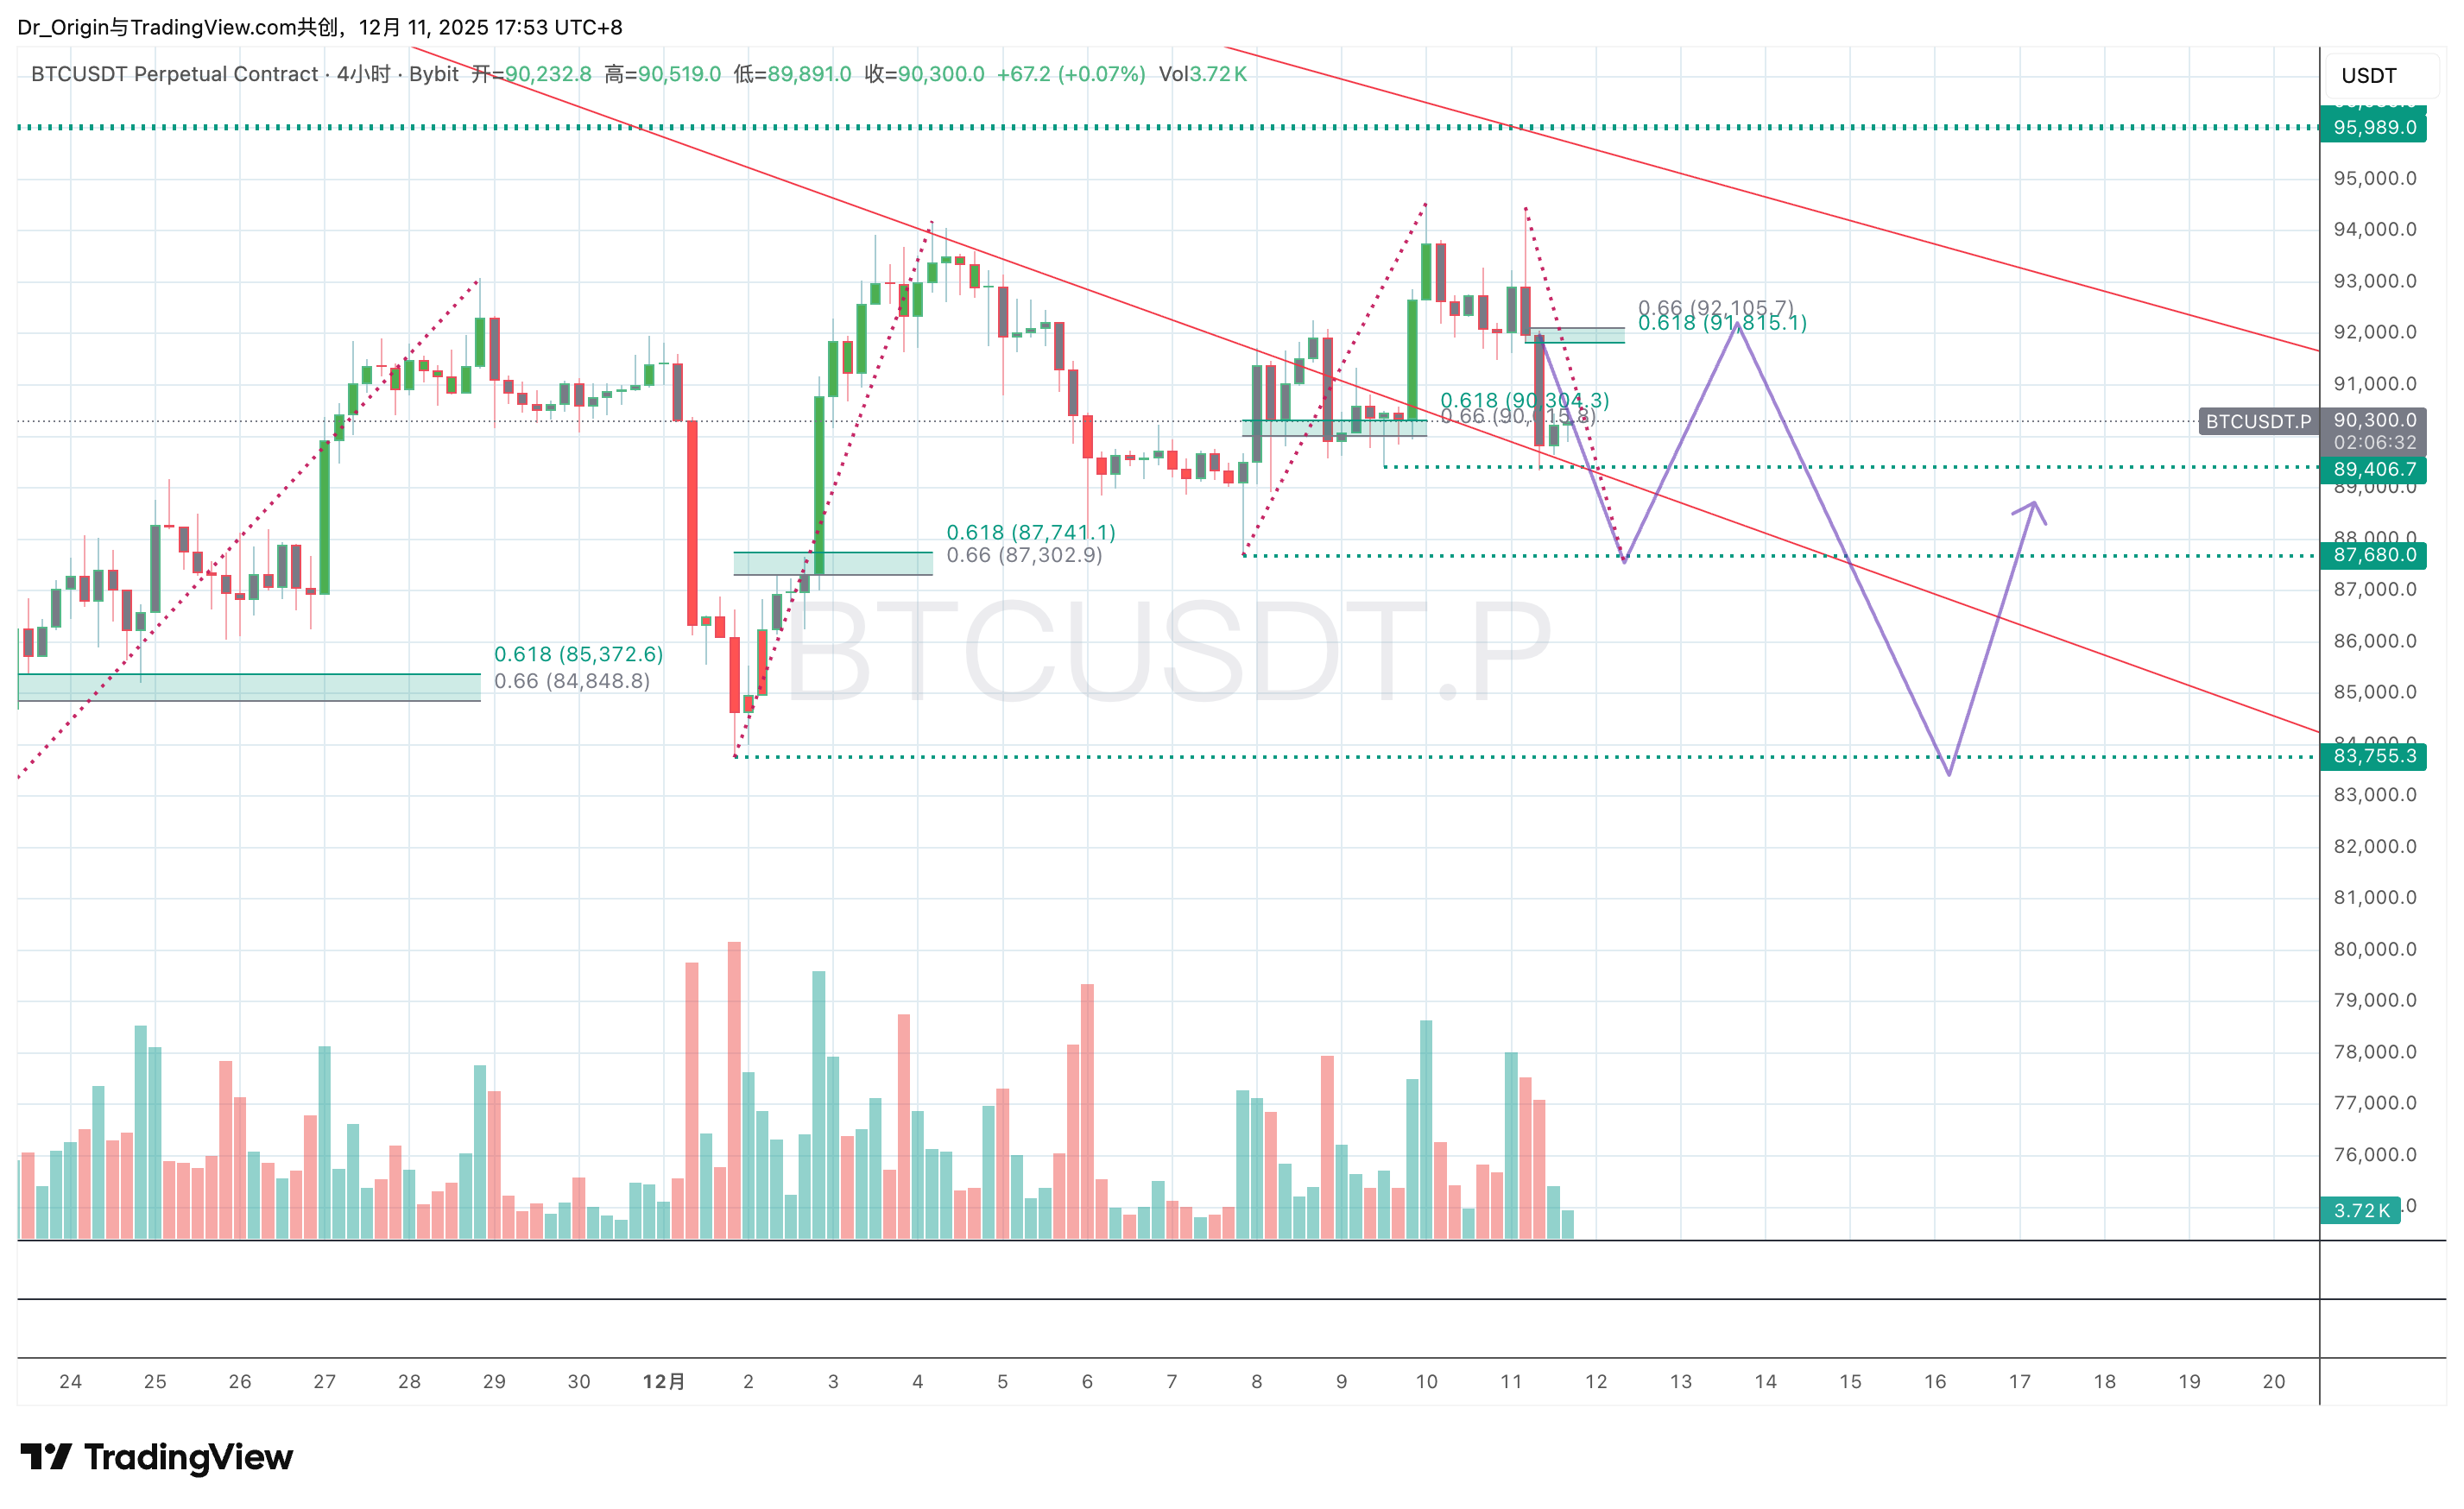
- Support–Resistance Flip: $92K previously acted as both support and resistance; once broken, it becomes a formidable ceiling.
- Fibonacci Resistance: From the $94.5K high, $92K aligns with the 0.618 retracement.
- Volume Node: $92K marks the lower boundary of recent value distribution; trapped longs will supply overhead resistance.
- Fair Value Gap: On the 4H chart, $92K sits within an unfilled FVG, a zone where institutions aggressively reassert control.
5.2 Execution Framework
Our guidance to members remains:
- Do not catch the falling knife near $87.7K despite expecting a bounce.
- Wait patiently for a rebound into the $92K region.
- Confirm entry via rejection signals: long upper wicks, bearish engulfing patterns, or microstructure failure.
5.3 Risk Control: Discipline Above All
We reiterate:
- Never chase breakdowns near $90K—risk–reward is asymmetrically poor.
- Right-side entries dominate: a failed retest after a structural low produces the cleanest short setups.A break below $87.7K followed by a rally into $92K constructs a textbook lower high, the hallmark of professional short positioning.
6. Wyckoff Perspective: $83K–$94K as a Distribution Range
6.1 Accumulation or Redistribution?
We expect Bitcoin to oscillate broadly between $83,000 and $94,000, forming a classical Wyckoff range.
Despite earlier medium-term upside projections toward $101K, current behavior aligns far more closely with redistribution, not accumulation.
Volatility is being weaponized to exhaust retail capital and disorient directional conviction.
6.2 UTAD: The Final Trap
Within Wyckoff theory, our previously identified $101K objective corresponds to a UTAD (Upthrust After Distribution) phase.
Mechanism:
- Price launches a convincing breakout.
- Market-wide FOMO erupts.
- Late longs enter aggressively; early shorts are forced to cover.
- Distribution completes.
Outcome: a violent reversal, driving price back into—and often below—the range.
Thus, whether $101K or another nearby level, the next breakout attempt represents maximum risk, not opportunity.
7. Summary and Forward Projection
Bitcoin is undergoing a meticulously engineered liquidity transfer process.
What appears as a pullback is a structural necessity for dominant players to reposition.
Projected Sequence
- Break below $89.4K
- Liquidity sweep through $87.7K
- Reflexive rebound
- Short entry near $92K
- Renewed push toward $94K+, completing UTAD
As traders, we do not need to predict every candle.
We only need to act where probability and structure converge.
For now: exercise patience. Wait for $92K.
Disclaimer
This report reflects the analytical views of Prism Insights and does not constitute investment advice. Cryptocurrency markets are highly volatile. Proper risk management and disciplined stop-loss execution are essential.