
Overview
This report is the direct continuation of the macro-bearish framework Prism Insights's initiated on October 2 . which has maintained a 100% track record of market validation over the past month. The core thesis is this: The "support" Bitcoin is currently showing at the $100,000 psychological level is not a structural, buyable bottom. It is merely a technical pause within a primary downtrend.
The market's macro structure has entered a state of Ultimate Weakness, a concept detailed in our previous report, "The Bitcoin Crash and the Retail Capitulation." The defining characteristic of this phase is that market operators, facing an extreme lack of buy-side confidence, no longer have the strength to execute "standard" liquidity hunts.
The Logical Chain: From the "$116K Front-Run" to the "$100K Failure"
To understand the game being played at $100,000, it must be placed within the coherent, validated analytical narrative that Prism Insights has built since the beginning of Q4 2025.
1.1 Foundation & Validation: From the $125K Top to the $20B Liquidity Cascade
The Prism Insights's narrative began on October 2 with our foundational report, "Bitcoin Cycle Top Characteristics, Warning of the Liquidity Hunt Trap." In that report, with sentiment at "Extreme Greed" and price still above $120,000, Prism Insights applied Wyckoff distribution theory to pinpoint that the market was in the final UTAD (Upthrust After Distribution) phase of a macro distribution cycle. We stated unequivocally that the $125,000 region was not a new bull market, but a bull trap engineered to create exit liquidity for smart money.
The market validated this forecast in the most dramatic way possible. On October 11, an epic cascade occurred. As detailed in our autopsy report, "The Cascade," nearly $20 billion in leveraged positions were liquidated, 95% of which were longs. This crash was irrefutable proof that our macro-top thesis was the only correct framework in the market.
1.2 The Critical Turning Point: The "$116K Front-Run" & The "Ultimate Weakness" Thesis
After the October 11 crash, the market entered the "liquidity farm" phase, as described in "Interlude: Navigating the Deceptive Calm" and "Hell Mode vs. Sweet Mode." During this phase, the market "cultivated" shorts via a slow, descending channel, preparing them for the next upward hunt.
However, a critical turning point emerged, which Prism Insights analyzed in our report on the "$116K front-run". The forecasted $116,500 liquidity hunt target was never fully hit. Instead, operators began dumping—front-running the move before the $116,000 zone was even reached.
This anomaly was not a failure of our framework; it was its deepest confirmation. It was extreme proof that the market had entered a state of "Ultimate Weakness." The game theory is simple: Operators had lost all confidence in the market's ability to absorb supply. They concluded the market could not even support an additional $500 rally to the perfect hunt location. They were forced to execute their distribution early, at any cost.
1.3 The Logical Consequence: The $100K Breach
The $116K front-run was a watershed moment. It proved the upward path for liquidity hunting had failed. Therefore, the only option left for operators was to hunt for liquidity downward. The current drop to $100,000 is not an isolated bearish event; it is the direct and inevitable logical consequence of the $116K front-run.
Since hunting shorts upward was no longer viable, the market has turned to the path of least resistance: dropping to trigger the stop-losses of "buy-the-dip" participants and, ultimately, to attack the liquidity vacuum formed in April 2025.
The current pause at $100,000 is just a technical stop on this "inevitable path downward." Prism Insights task is to deconstruct the game being played at this stop and draw the precise tactical guide for the next leg of the journey.
Deconstructing $100,000: Why the Market Must Pause Here
We anticipate the market will find temporary support at $100,000 and consolidate for "about one week."
2.1 The Technical Confluence
$100,000 is not a mere psychological number; it is a "support cluster" formed by a confluence of key technical levels. The pause here is a technical necessity.
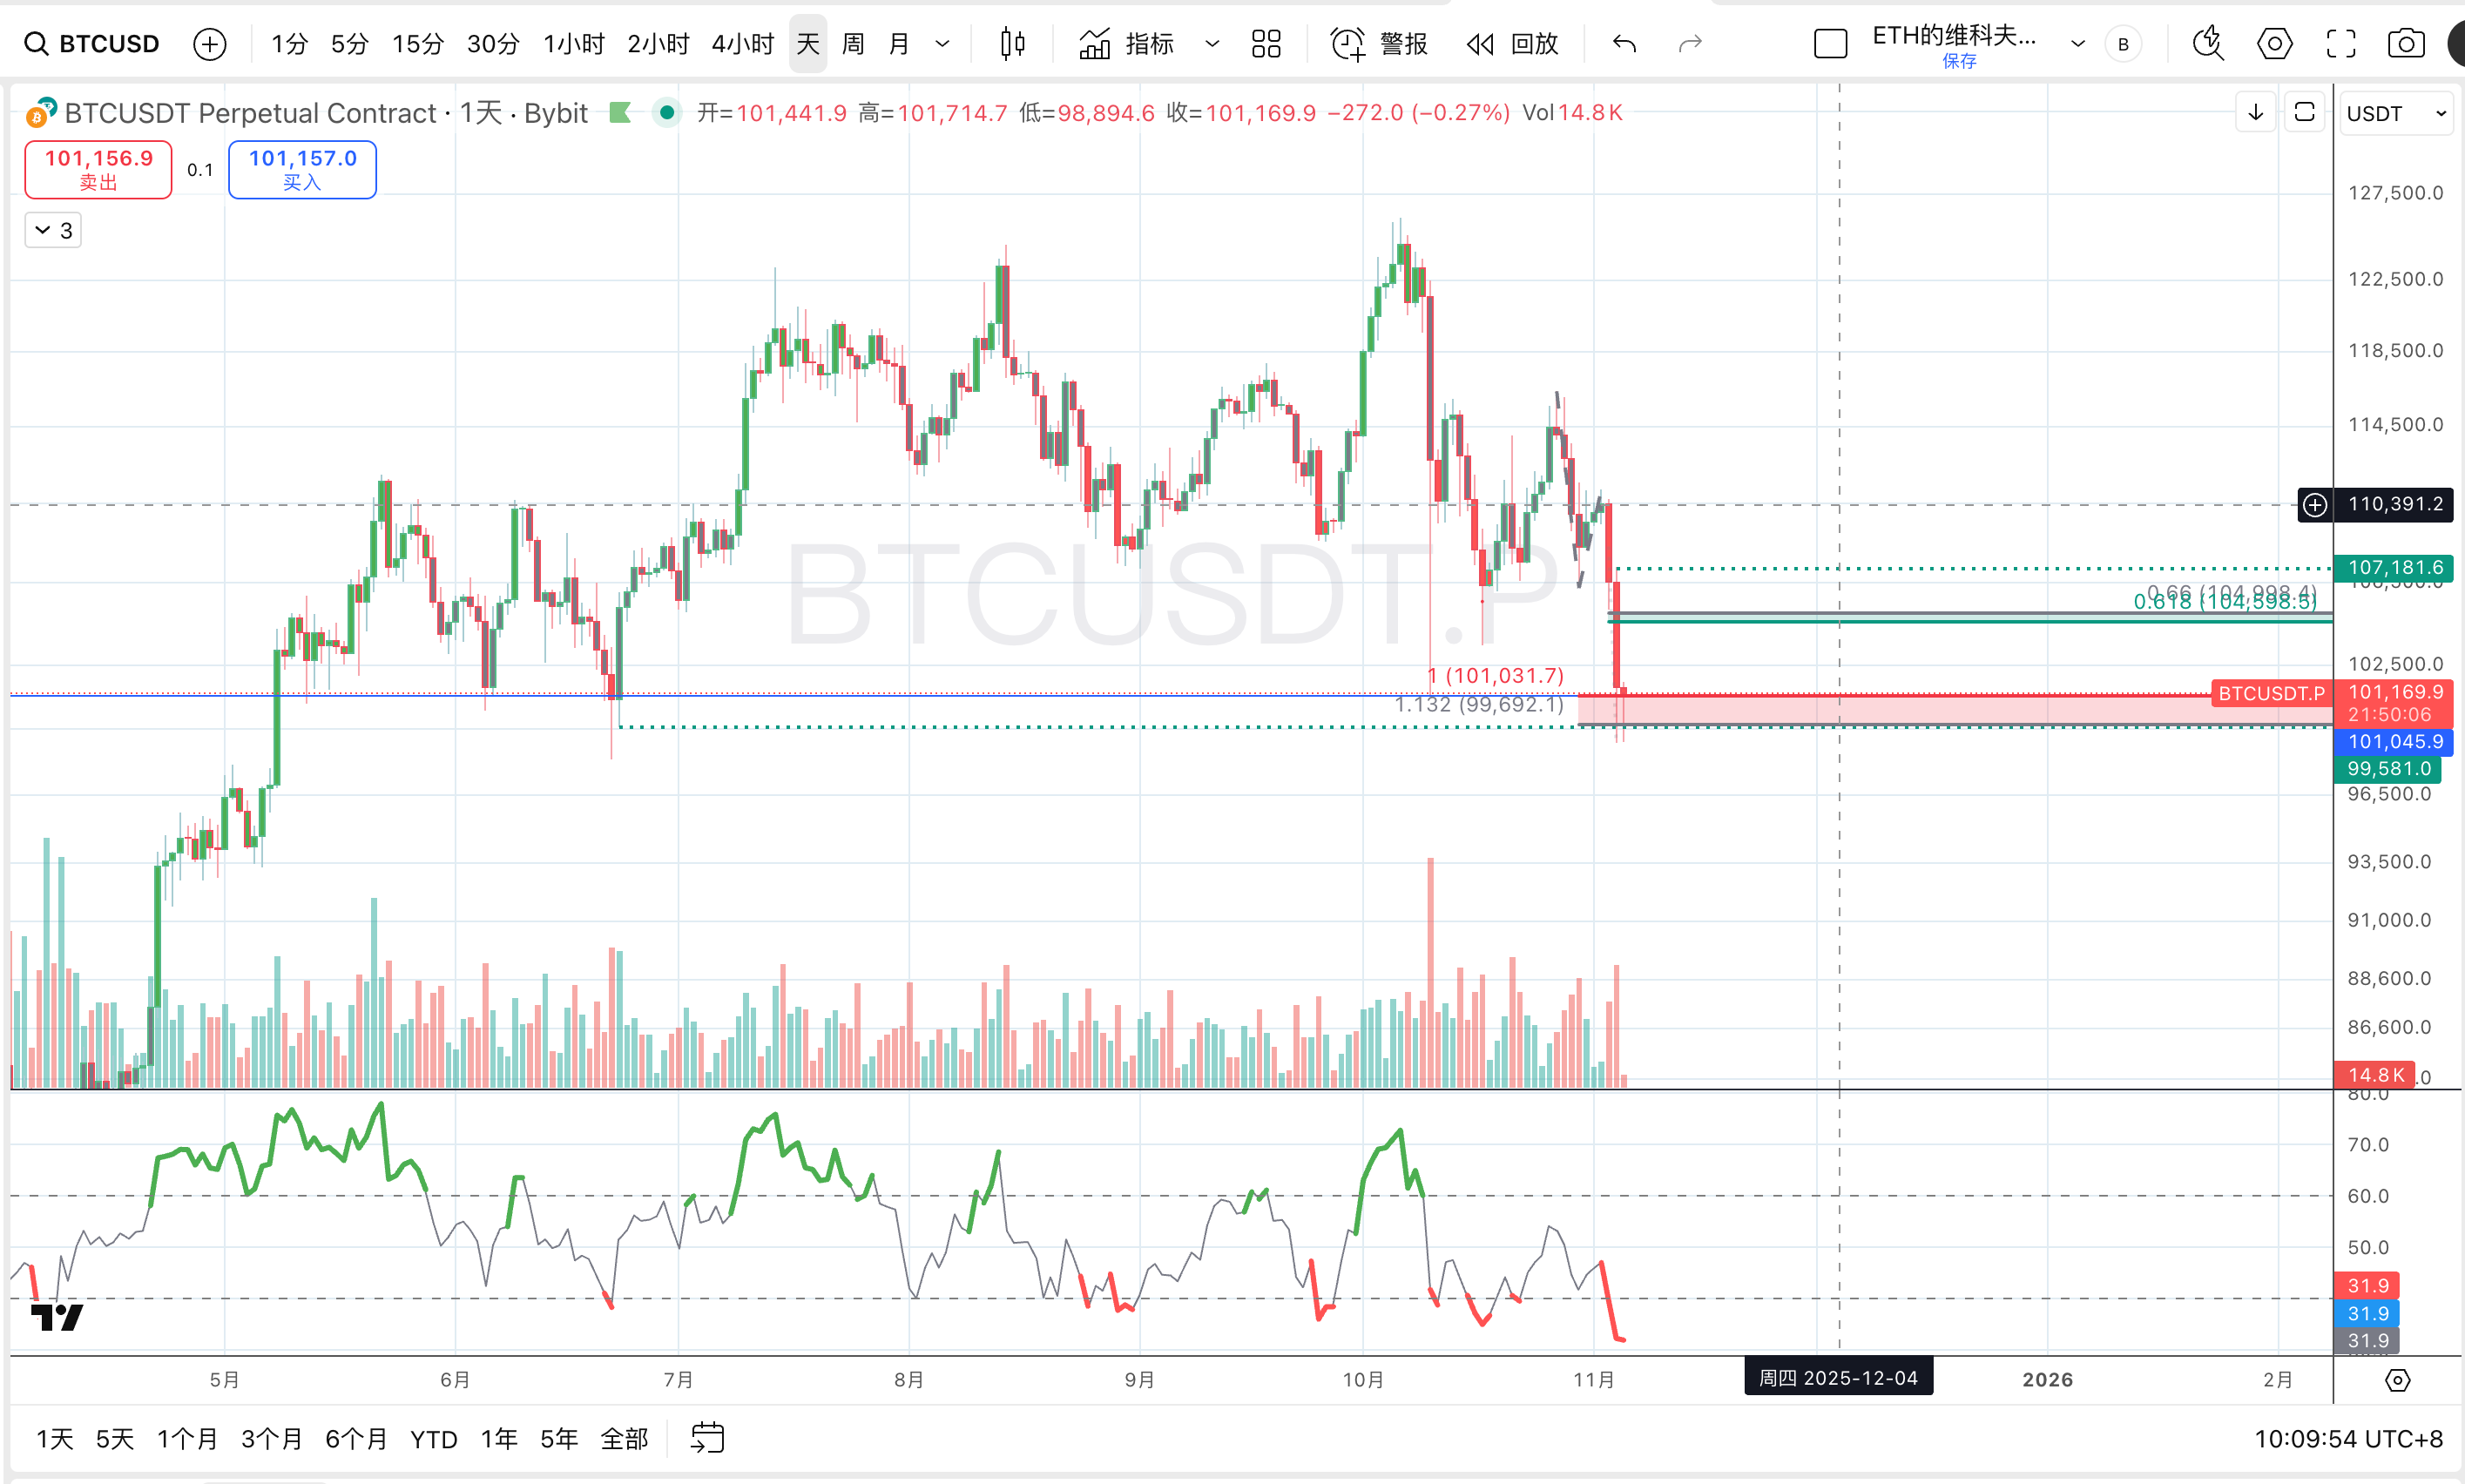
- FVG Fill (Fig. 1): Price has now precisely filled the daily-level Fair Value Gap (FVG) formed during the strong rally in June (at the ~$100,988 level). This is a critical "mission complete" signal. In technical analysis, an FVG fill often terminates a trend and triggers mass profit-taking and technical buying.
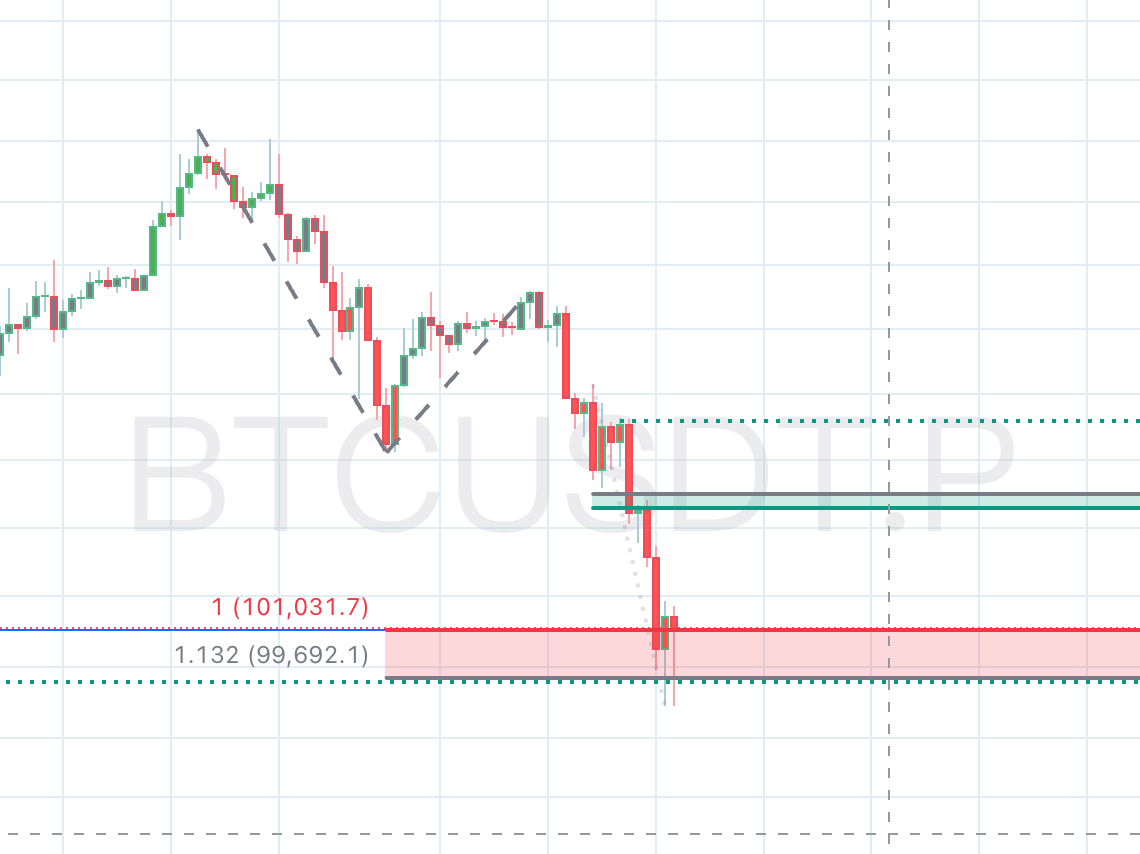
- Fibonacci Extension (Fig. 1): Price has perfectly and precisely hit the 1.132 Fibonacci trend extension level ($99,692.1). This "unconventional" level, derived from complex measurements of recent highs and lows, is a major focus for algorithmic trading and institutional quant models. It is a powerful trigger for a precise reversal or consolidation.
- Key Horizontal Support: The $101,045 level (blue line) was the low of a prior consolidation range and now forms a classic S/R flip zone, likewise attracting market attention.
2.2 Momentum & Sentiment Reset
Beyond price levels, momentum indicators are also signaling a strong "pause".
- RSI Oversold (Fig. 1): The daily Relative Strength Index (RSI) has dropped to 31.9, deep in "oversold" territory. This clearly indicates that downside momentum is, for the moment, exhausted. The market physically requires time to reset this momentum... to build potential energy for the next major move.
- Market Psychology: $100,000 is a powerful psychological line in the sand. Breaching such a major round number requires enormous energy and consensus. A battle here is inevitable, forming a consolidation range.
2.3 Conclusion: From Support Level to Liquidity Processing Station
In summary: The support at $100,000 is real, but it is merely a "technical brake," not a "structural reversal" bottom.
This "pause" is a "Liquidity Processing Station" that serves the operators' goals. Its functions are:
- Liquidity Absorption: Absorbing profit-taking from shorts who entered at $116,000.
- Liquidity Manufacturing: Luring in "dip-buyers" to create fuel for the next leg down.
- Shaking Out: Frightening weak-handed shorts into closing too early, causing them to miss the main drop.
This consolidation is necessary, as it builds the new battlefield for Prism Insights's core thesis: the $104,000 Distribution Trap.
The Game Theory of a Bear Rally: The $107K Bait & The $104K Trap
3.1 The "Bait": The $107K Consensus Trap
Prism Insights believes that under normal circumstances, price "should" rally to $107K to wipe out the chase-shorts. This judgment precisely identifies the "bait" in the consensus trap.
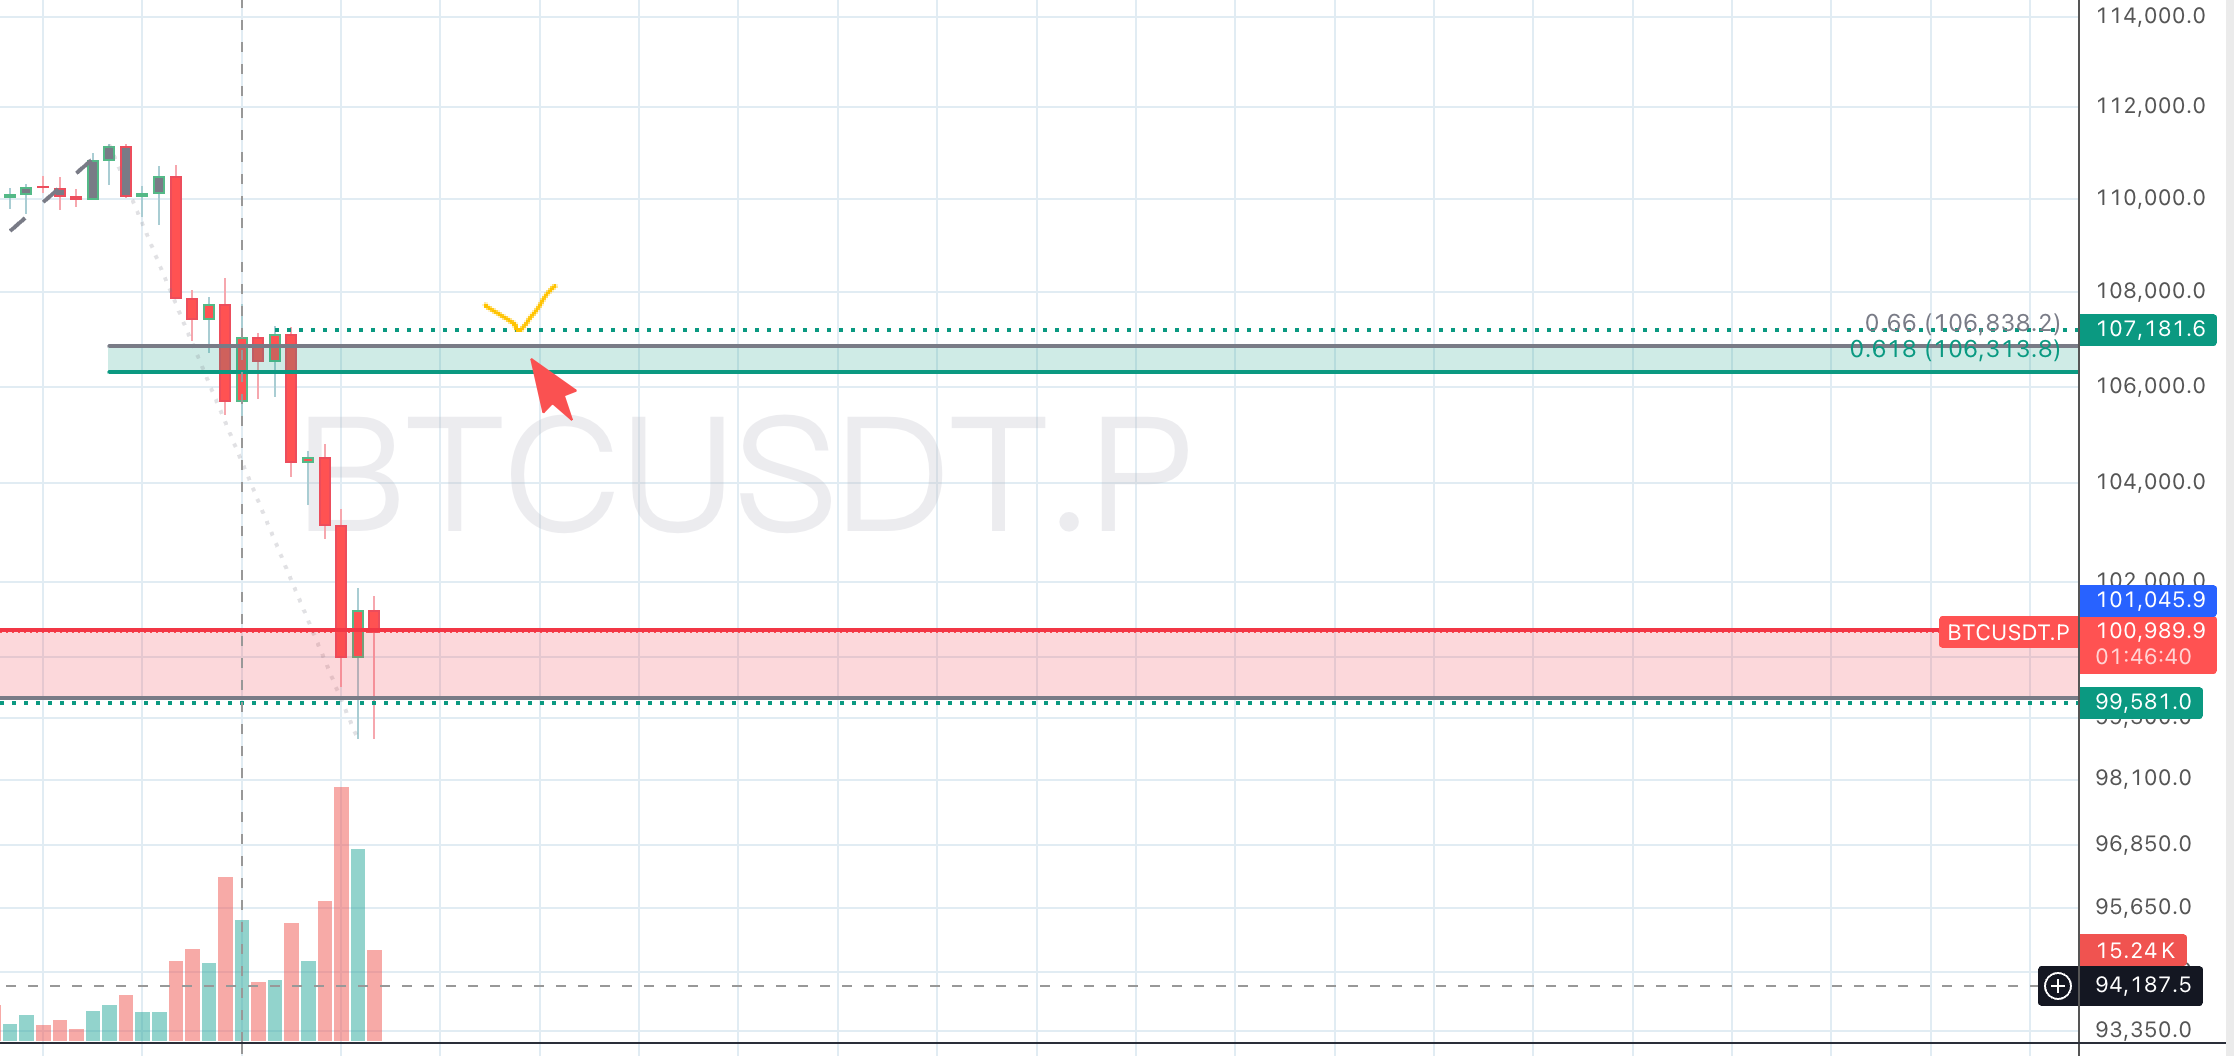
- Why $107K?
- Structural Resistance: It's the high-volume node of the consolidation that formed after the Oct 11 crash.
- Liquidity Pool: It is the most obvious, logical placement for the stop-loss orders of "chase-shorts" (i.e., those who panic-shorted the $103,500 breakdown).
- The "Normal" Game: In a healthy bear market... operators would push price to $107,000. This would hunt those stops with maximum efficiency, acquire ample buy-side liquidity, and allow them to reload shorts... $107,000 is the "standard" rally target that consensus... is waiting for. However... the market never takes the most obvious path.
3.2 The "Trap": The Ultimate Weakness Distribution Zone
In sharp contrast to the $107K bait, we published this analysis internally to our members:
The following analysis contains precise entry levels and is available to paid subscribers only. To ensure your own trading execution, paid members must not share this content externally.
"In this bear market, operators will front-run and give no chance for trapped longs to exit. The rally will hit $104K and go straight down."
This judgment is the perfect application and logical fractal of Prism Insights Ultimate Weakness framework.
- Continuation of the Core Principle: The "front-run" logic is identical to the $116K front-run. The market will, once again, front-run the obvious liquidity target ($107K).
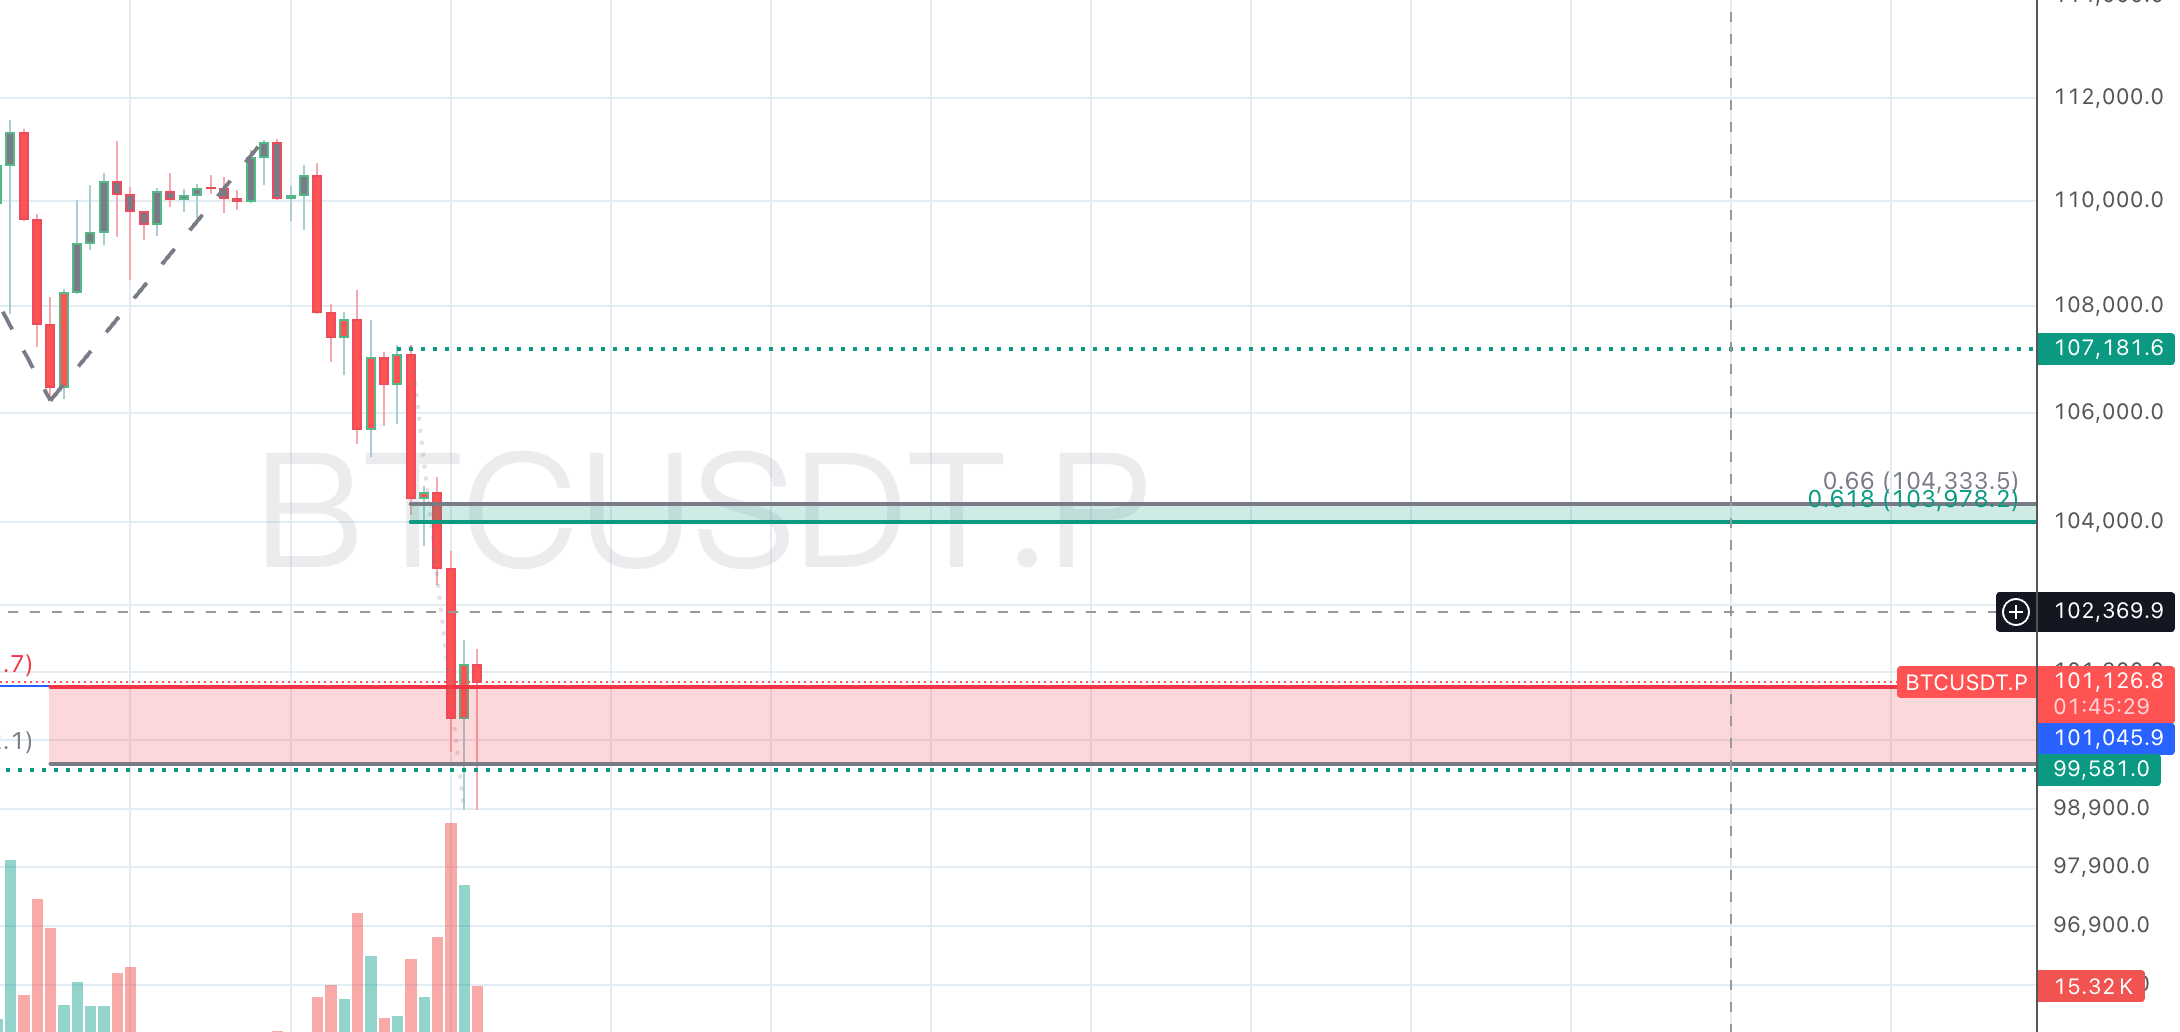
- Why $104K?
- Hidden Technical Confluence: As shown below, the $104,000 area ($103,978 - $104,333) is a precise, but not obvious, technical resistance cluster. It is both an un-filled 4-hour FVG and the 0.618 Golden Pocket retracement...
- Maximal Operator Efficiency (in a weak market):
- Goal 1 (Induce Longs): A rally to $104K looks strong enough to make dip-buyers add to their positions.
- Goal 2 (Stop-out Tight Shorts): It's just high enough to wipe out shorts with tight stops (e.g., at $102K, $103K), providing just enough fuel to sell into.
- Goal 3 (Deny Exits): It absolutely will not touch $107K. This shatters all hope for anyone trapped above $107K. It is the most cruel, most bearish, and most psychologically painful move possible.
3.3 The Unified Insight: $104K is the Quantitative Proof of Operator Collapse
The $104K rejection point is the quantitative re-confirmation of the Ultimate Weakness thesis. The logic is irrefutable:
- If operators were confident, they would wait for the optimal price of $107K to sell.
- By choosing $104K—a worse, lower price—they prove they are desperate to distribute.
- This proves they believe the market does not even have the strength to reach $107K. They are afraid if they don't sell at $104K, they won't even get that price.
- This is the exact same psychology and logic as their behavior in the previous report, where they were afraid the market could not reach $116,500 and chose to front-run the move before $116k.
This is the exact same psychology as the $116K front-run. Our Ultimate Weakness framework is the only model that predicts this $104K trap. This is not a rally; it is the final distribution before the next leg down.
Tactical Guide: Operations Before the Next Cascade
Analysis must become actionable. The Prism Insights macro-bearish thesis is unchanged: our end-of-November strategic target remains firmly set on the major daily FVG below $90,000. The $100K-$104K game is merely a tactical distribution phase on the path to that target.
Tactically, Prism Insights refuses to play the bottom-guessing game at $100,000. We advise members to remain patient and use the high-certainty $104K trap as the primary short entry / reload zone.
The 100% accuracy of Prism Insights framework comes from being one step ahead of the market.
Based on this validated framework, we issue a high-confidence tactical forecast: The coming rally will be capped below the $104,000 region. This prediction is based on the core principle of operators front-running... a fractal re-enactment of the $116K logic.
Therefore, the current consolidation at $100,000 exists for one purpose: to build the final $104K distribution trap. The tactical play... is to use this anticipated false rally to establish or add to short positions in the $104,000 region. Once distribution at $104K is complete, the path to the core liquidity vacuum below $90,000 will be clear.