
Bitcoin’s current price action around the $116,000 level is not an accident, nor is it a deviation from our analytical path. It is the direct, empirical validation of the bearish thesis we have held since October 2.
This event is precisely the manipulative price action we have long forecasted: a "liquidity hunt" engineered to build a final pool of buy-side liquidity before the primary downtrend begins. This signals that the "endgame manipulation" we have been tracking for weeks has entered its climax phase.
Part I: Thesis Confirmed. The Endgame Manipulation is Live.
Bitcoin’s current price action around the $116,000 level is not an accident, nor is it a deviation from our analytical path. It is the direct, empirical validation of the bearish thesis we have held since October 2.
This event is precisely the manipulative price action we have long forecasted: a "liquidity hunt" engineered to build a final pool of buy-side liquidity before the primary downtrend begins. This signals that the "endgame manipulation" we have been tracking for weeks has entered its climax phase.
This event forms a complete and coherent narrative arc with our entire series of deep-dive reports. It is the logical and inevitable "harvest" phase of the "liquidity farm" detailed in our "Interlude: Navigating the Deceptive Calm" and "Hell Mode vs. Sweet Mode" analyses. It is also a small-scale, self-similar "reenactment" of the large-scale Upthrust After Distribution (UTAD) that we predicted in our Q4 2025 Strategic Outlook and which was validated by the October 11 market crash.
The market is currently in a state of maximum psychological deception. The move to $116,000 is designed not only to trigger stops, but to instill profound doubt even in the minds of committed bears, forcing them to ask: "Is this a real breakout? Is our thesis wrong?" This manufactured uncertainty is the final catalyst needed to ignite the true decline, as it both cleanses weak-willed shorts and attracts the last wave of FOMO-driven longs.
Part II: Deconstructing the $116,000 False Breakout
Micro-Level Chart Analysis
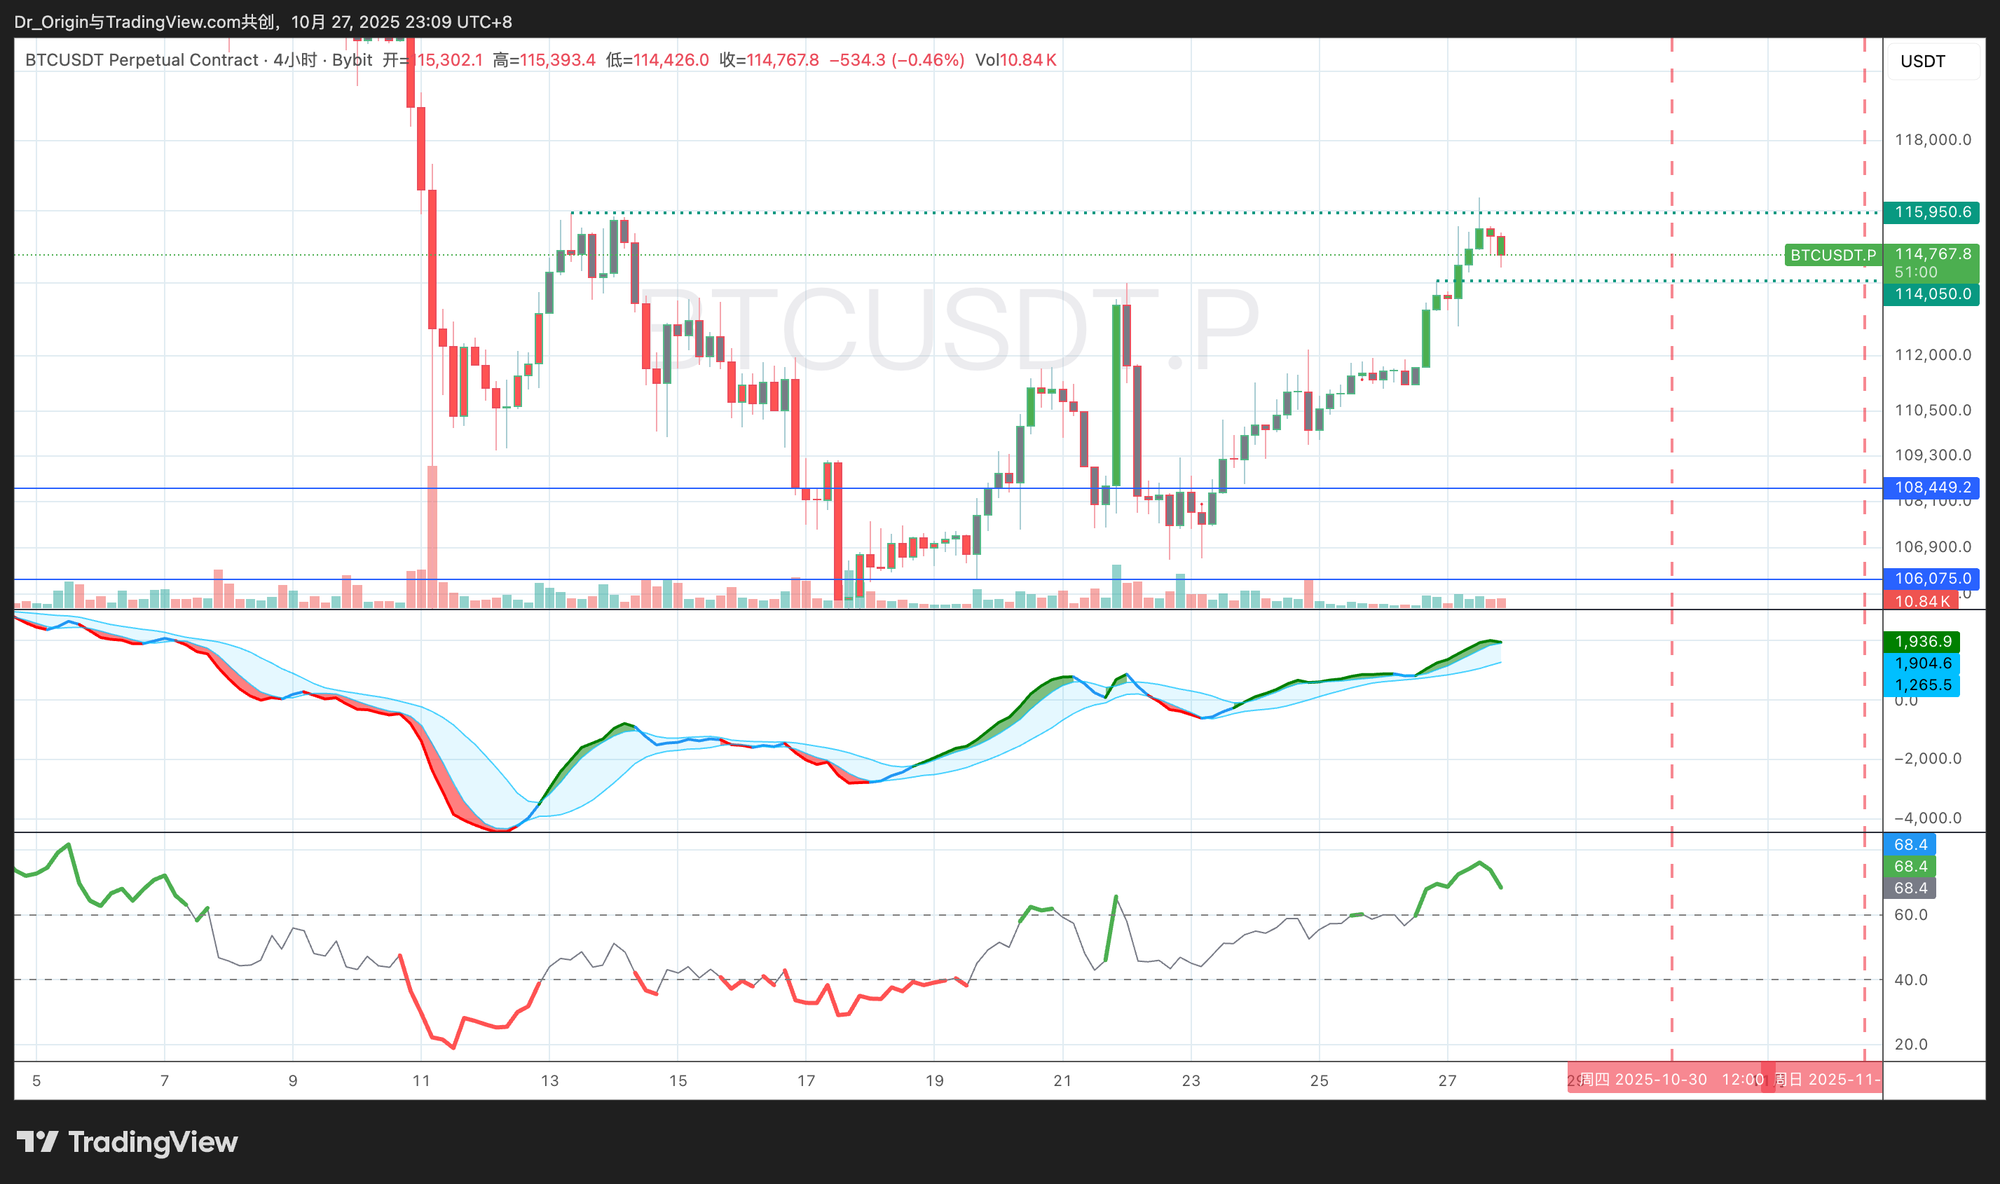
- Price Action: After a rapid spike to the $115,950 resistance, price was immediately met with significant selling pressure and rejected, leaving a long upper wick on the latest candle. This pattern is the classic signature of a liquidity probe or "stop hunt," not a healthy, demand-driven breakout.
- Indicator Analysis:
- Top Indicator (MACD): On the 4-hour MACD (top chart), price failed to make a new high, while the MACD indicator did make a new high. This shows a "hidden bearish divergence," which indicates that longs have exerted maximum effort, yet the price is failing to advance. This is often a precursor to the next bearish attack. This final pulse of momentum is not a sign of trend health; it is the artificial, short-term strength required to execute the tactical mission of a stop hunt.
- Bottom Indicator (RSI): The RSI (bottom chart) has clearly entered the upper "overbought" territory (a reading above 60). This, too, should not be read as sustainable buying power, but as the manufactured market atmosphere required to build the trap.
- Volume: The observed volume on the breakout candle did not show an overwhelming surge. A true, structural breakout is typically accompanied by a significant expansion in volume. A manipulative thrust, however, often has ambiguous volume; the real volume expansion typically appears on the subsequent reversal and breakdown.
The "Re-enactment" Concept
This manipulation at $116,000 is a small-scale, self-similar fractal of the large-scale UTAD that preceded the October 11 crash.
The underlying principle is identical: push price above a key resistance level to trigger short-stop orders (passive buying) and induce breakout traders (active buying), creating a deep, concentrated liquidity pool for large entities to sell into. This proves the consistency and repeatability of the market operator's playbook. The $116,000 level is not accidental; it is the confluence of technical resistance, a psychological barrier, and—most critically—the area of densest concentration for the short-stop orders that were "cultivated" during the prior consolidation.
Therefore, this price action was not a random walk; it was a targeted, "surgical strike." The sharp spike can be understood as an operator's "probe" into the order book to confirm the exact location and depth of the stop-loss liquidity. The swift rejection that followed indicates the mission was successful: stops were triggered, liquidity was provided, and "smart money" successfully absorbed that liquidity and completed a portion of their distribution. It is a clear causal chain: the existence of the stop-loss pool caused the price to be magnetically drawn to this level.
Part III: Re-examining the Liquidity Trap
The "Liquidity Farm" Harvest
Pulling back from the micro-analysis, the current price action perfectly validates our "liquidity farm" theory. The market's prior dull, boring "Hell Mode" was a phase with clear strategic intent: to "cultivate shorts." Derivatives data provides quantitative support: the slow rebuilding of Open Interest, paired with funding rates persistently in neutral-to-negative territory, clearly showed the market's risk profile had shifted from over-leveraged longs to a growing, predictably-placed population of shorts. Therefore, this probe to $116,000 serves the dual purpose we have been outlining for weeks:
- Stop Liquidation: To trigger the first wave of buy-stops from the cultivated shorts.
- Inducement: To manufacture a "breakout" narrative, luring in FOMO-driven retail and momentum traders, which provides the final wave of liquidity for institutional exit.
Beware the Secondary False Breakout
We must remain hyper-vigilant for a secondary false breakout. In the game of manipulation, a higher, more deceptive spike (e.g., a thrust toward $117,000 or even higher) would be the "master stroke" of this operation. Such a move would be designed to surgically liquidate the more sophisticated traders who correctly identified the first spike as false and have already entered short positions. The operator (the "Composite Man") possesses a near-perfect map of liquidity; they know where all the stop-loss clusters are. This first false breakout has actively revealed a part of their hand.
Large participants must sell massive volume without crashing the price, and doing so directly is highly inefficient. Therefore, artificially engineering buy-side pressure by hunting stops and inducing FOMO becomes a game-theory necessity. A potential second thrust is an extension of this logic—an advanced tactic to hunt the more elusive, professional counter-party liquidity.
Part IV: The Updated Short Plan
Core Principle
Our core trading principle is not to predict the exact top, but to trade the confirmed failure of the top. We are patiently waiting for the market to fully reveal its hand—for this manipulative thrust to fail decisively and for price to be rejected back into the prior trading range.
A Multi-Layered Entry Strategy
To manage and hedge the risk of a secondary stop-hunt, we have developed a flexible, layered entry plan.
- Entry 1 (Initial Probe Position): Based on the failure of the initial $116,000 probe, a smaller "scout" position can be deployed. The trigger is a decisive break back below a key S/R flip level, such as $115,753 as marked on our technical charts.
- Entry 2 (The Decisive Position): The main position should be deployed after the failure of a potential secondary spike. If price continues to thrust higher (e.g., into the $117,000 region) but is then met with an even more violent rejection, this constitutes the highest-probability entry signal. The trigger for this is a price crash and reclaim below the first high (approx. $116,373).
How to Set Stop-Losses:
- Wide Stop Strategy (Set & Forget): If you prefer to set it and not watch the screen, a static, wide stop is appropriate. This stop should be placed above the absolute high of the entire manipulative structure (e.g., a daily close above $118,500). This method allows room for extreme volatility.
- Dynamic Stop Strategy (Active Management): If you can actively manage the position, a tighter, dynamic stop offers a superior risk/reward ratio. This stop can be placed just above the high of the reversal candle. If this stop is breached, the position should be closed immediately to await a secondary entry signal.
Short Thesis Invalidation:
- Our bearish thesis is invalidated if we see two consecutive daily closes above $118,500. If price stabilizes above this level, the market structure will have shifted from a false breakout to a potential uptrend continuation.
Final Word: Conviction Amidst Maximum Deception
The current market environment is not a display of strength or recovery; it is the final, most deceptive chapter in a protracted distribution campaign. Every detail of this price action is meticulously designed to create maximum confusion and elicit emotional, irrational decisions. Our edge comes from an analytical framework that has been repeatedly validated (most recently by the October 11 crash) and the iron-clad execution discipline to match it.
While other participants, driven by noise and emotion, are being tortured in "Hell Mode," we are calmly executing a well-defined plan, enjoying our "Sweet Mode." In this "pro-player's era," generating Alpha is no longer a function of audacity; it is a function of the ability to see through the deception and strictly follow the protocol.