
A 2025 Q4 Strategic Outlook: A Bitcoin Cycle Top Thesis Based on a Multi-Dimensional Analytical Framework
Part 1: Executive Summary & Core Thesis
1.1. Central Thesis
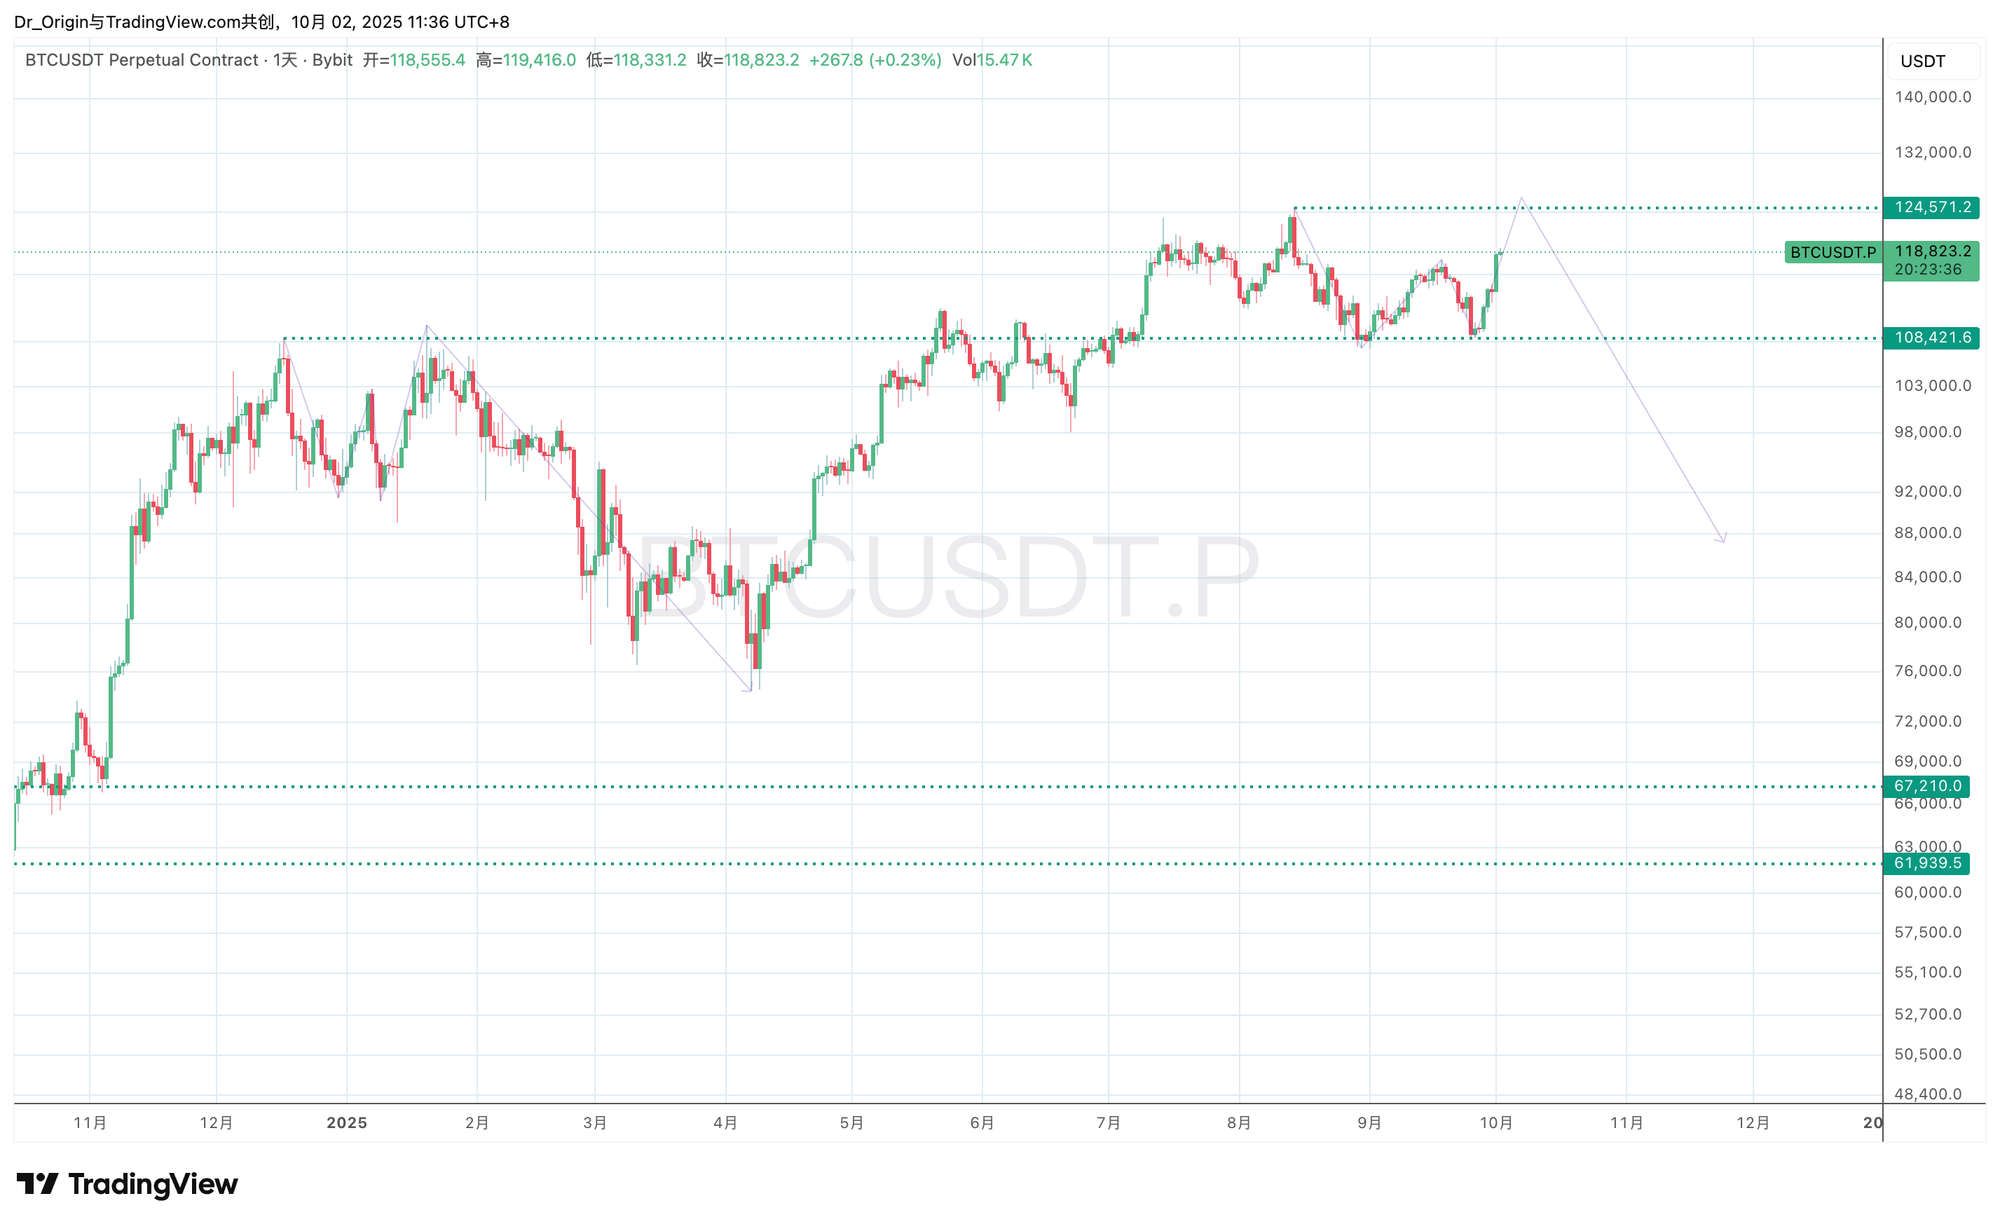
The core thesis of this report is that the Bitcoin market is currently in the final, and most deceptive, stage of a multi-month macro distribution cycle. The powerful rally initiated on September 28 is not the beginning of a new, sustainable bull market. Instead, it is a structurally flawed, derivatives-driven, strategic manipulation designed to engineer an ultimate liquidity event. Its structure perfectly matches the "Upthrust After Distribution" (UTAD) phase of a classic Wyckoff Distribution model.
The fundamental objective of this maneuver is to sweep the upside liquidity resting above the previous high ($124,571) by clearing out short-stop losses, while simultaneously luring in the last cohort of breakout buyers. This creates the optimal conditions for large institutions, or "Smart Money," to complete their final exit. Once this meticulously engineered "hunt" is complete, the market—plagued by extreme internal leverage and systemic fundamental weakness—will face a violent, long-term downtrend, marking the entry into a multi-quarter macro bear market.
1.2. The Seven-Dimension Analytical Framework Scorecard
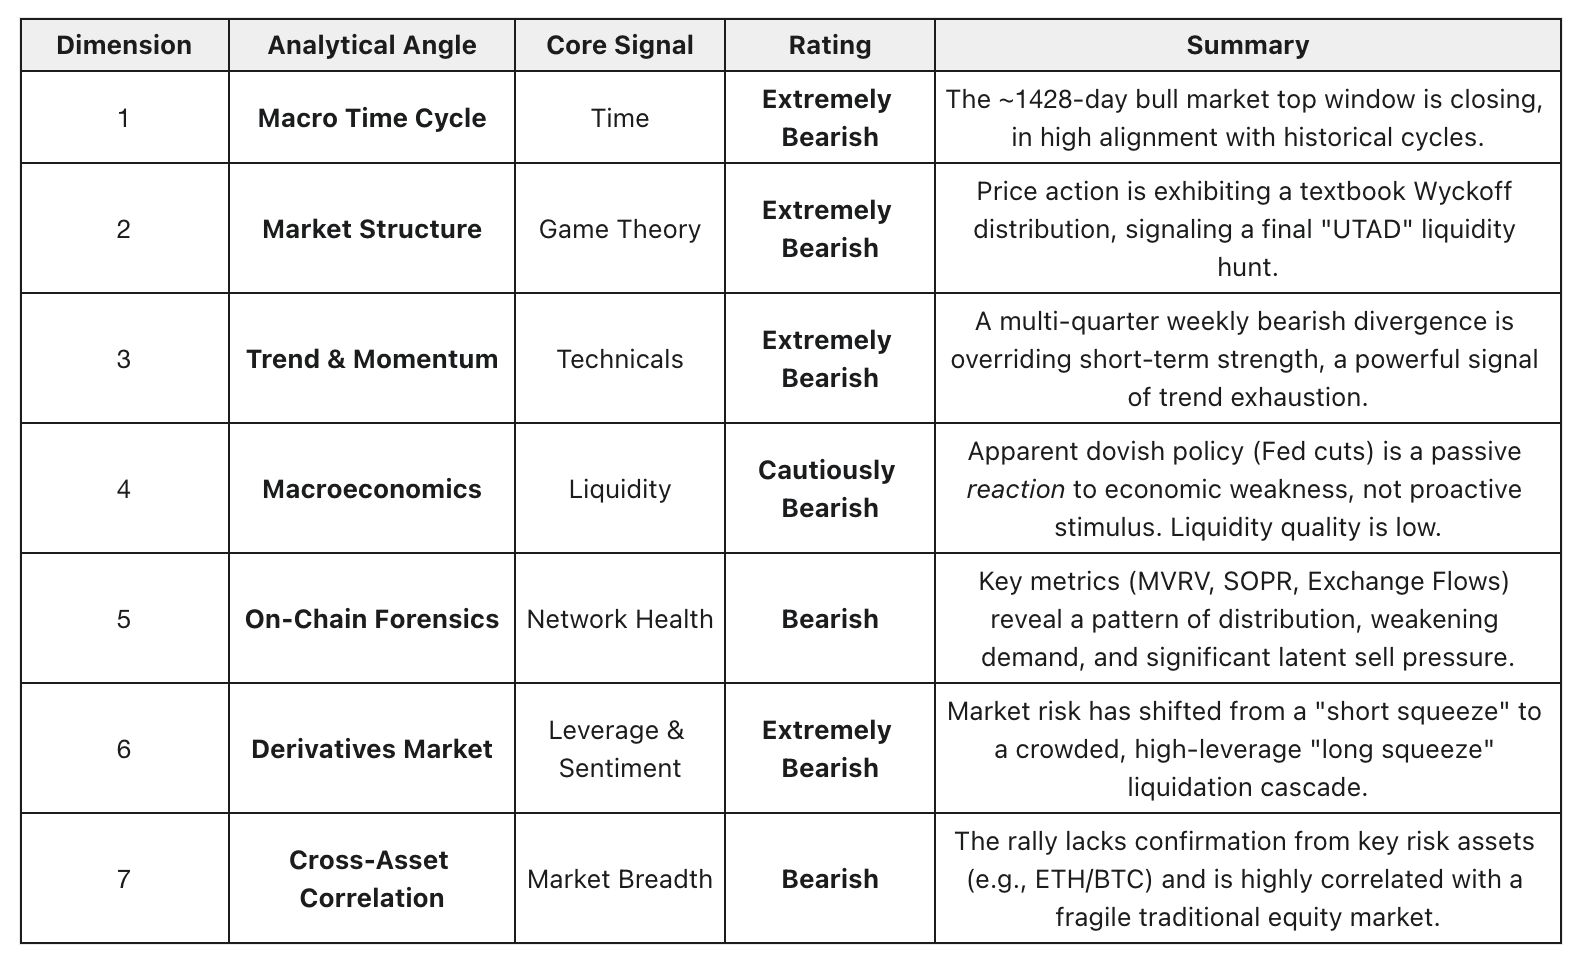
To systematically assess the market's condition, this report utilizes a comprehensive analytical framework comprising seven critical dimensions. The following table provides the core signal and overall rating for each dimension, visually demonstrating the breadth and depth of our bearish thesis.
1.3. Core Strategic Imperative
Based on this analysis, we strongly advise an immediate and decisive strategic shift: Pivot fully from the bull-market-inertia "Buy-The-Dip" mindset to a defensive, bear-market "Sell-The-Rally" (STR) posture. All portfolio actions should be oriented around capital preservation and, following the confirmation of the UTAD failure, the strategic establishment of short positions. Part 3 of this report provides a detailed tactical playbook, including specific entry conditions, risk control protocols, and price targets.
Part 2: Deep Deconstruction of the Seven-Dimension Framework
2.1. Macro Time Cycles: The Four-Year Window is Closing
The cornerstone of our macro analysis is Bitcoin's strict adherence to its four-year cycle, which is intrinsically linked to its "halving" events. Historical data does not simply repeat; it is a map of collective market psychology and capital flows across time. The current temporal node places us squarely within the high-risk distribution window identified by historical cycles.
Quantitative Cycle Analysis
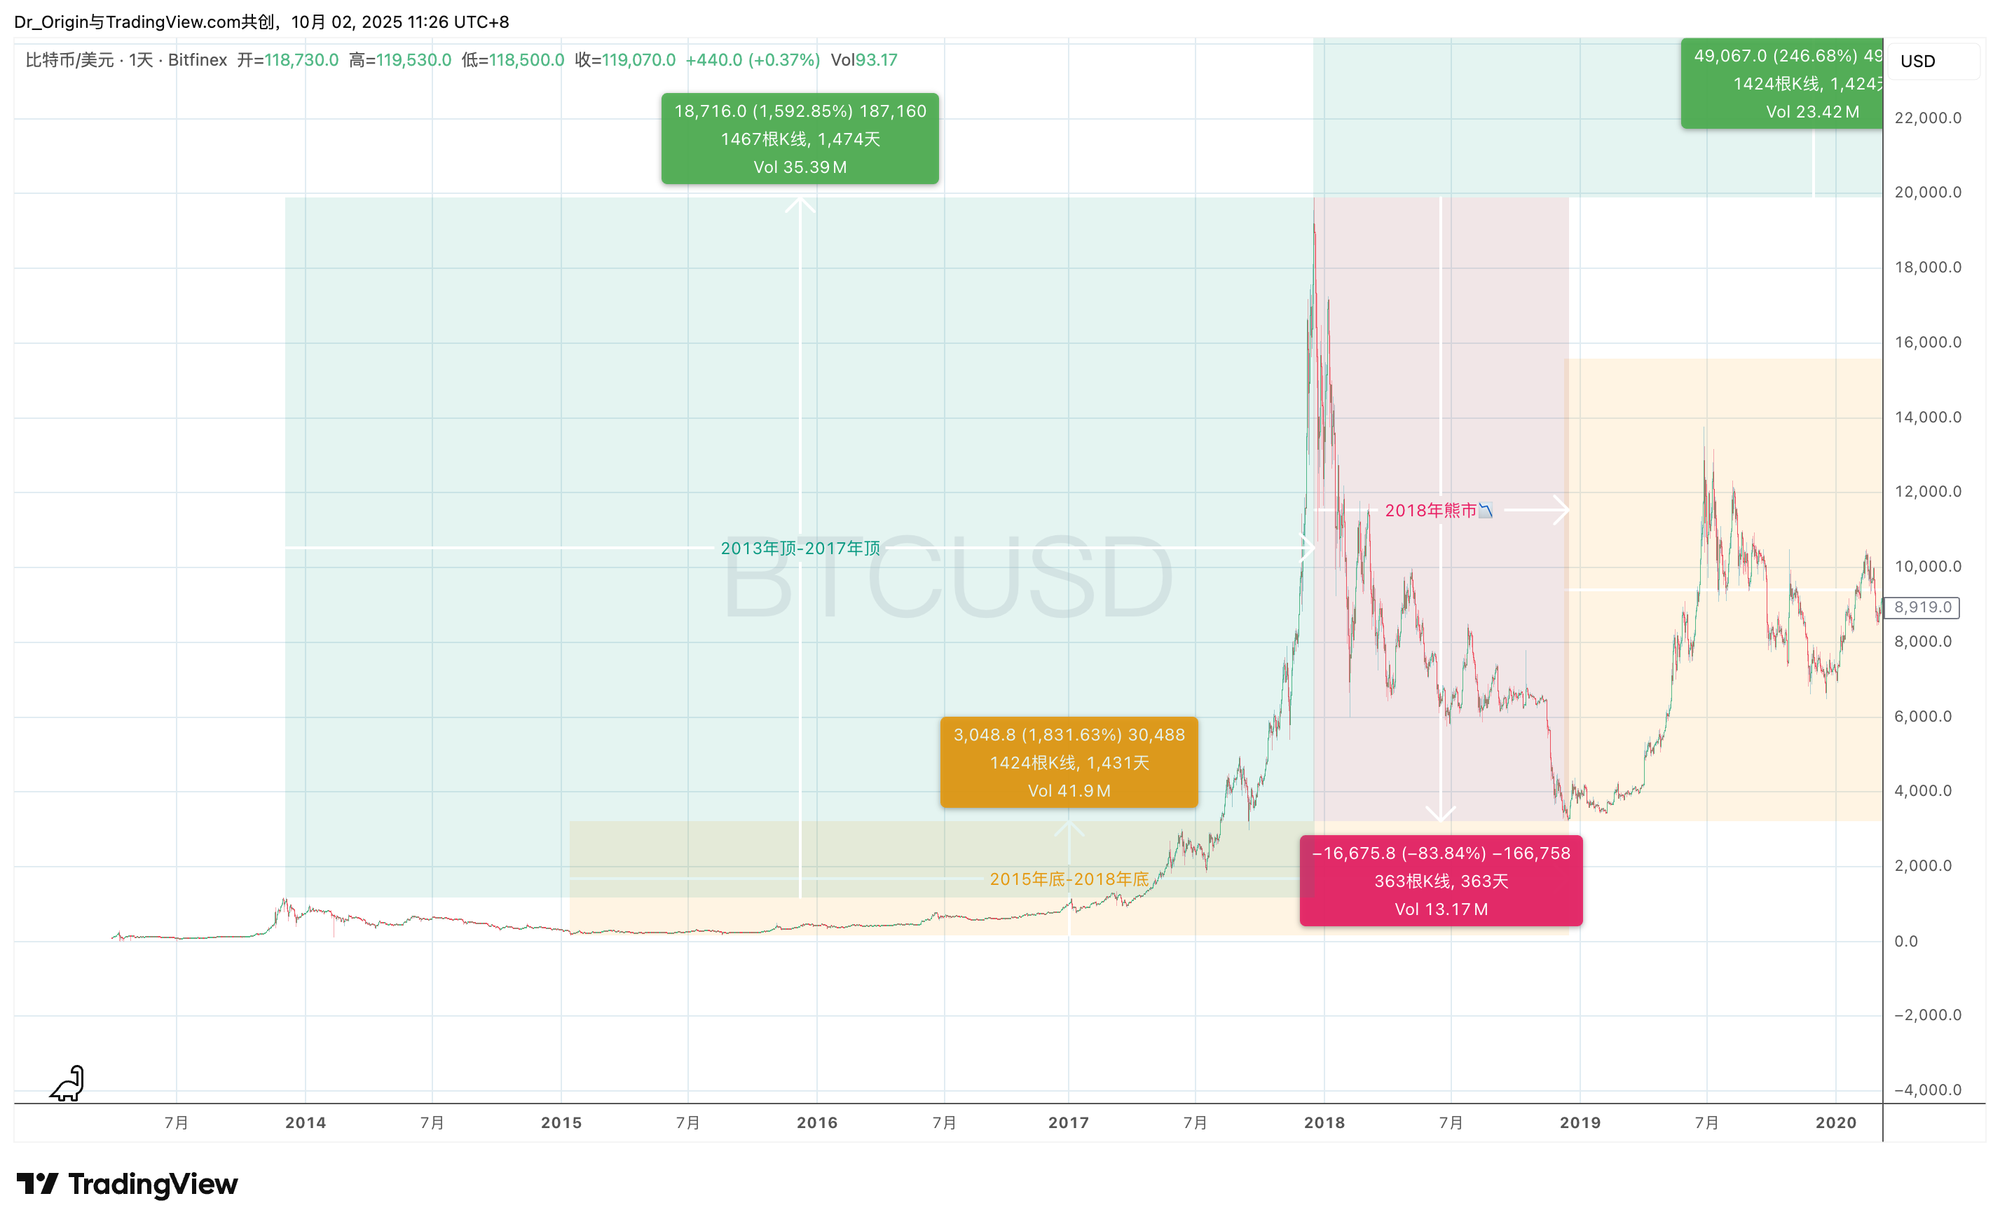
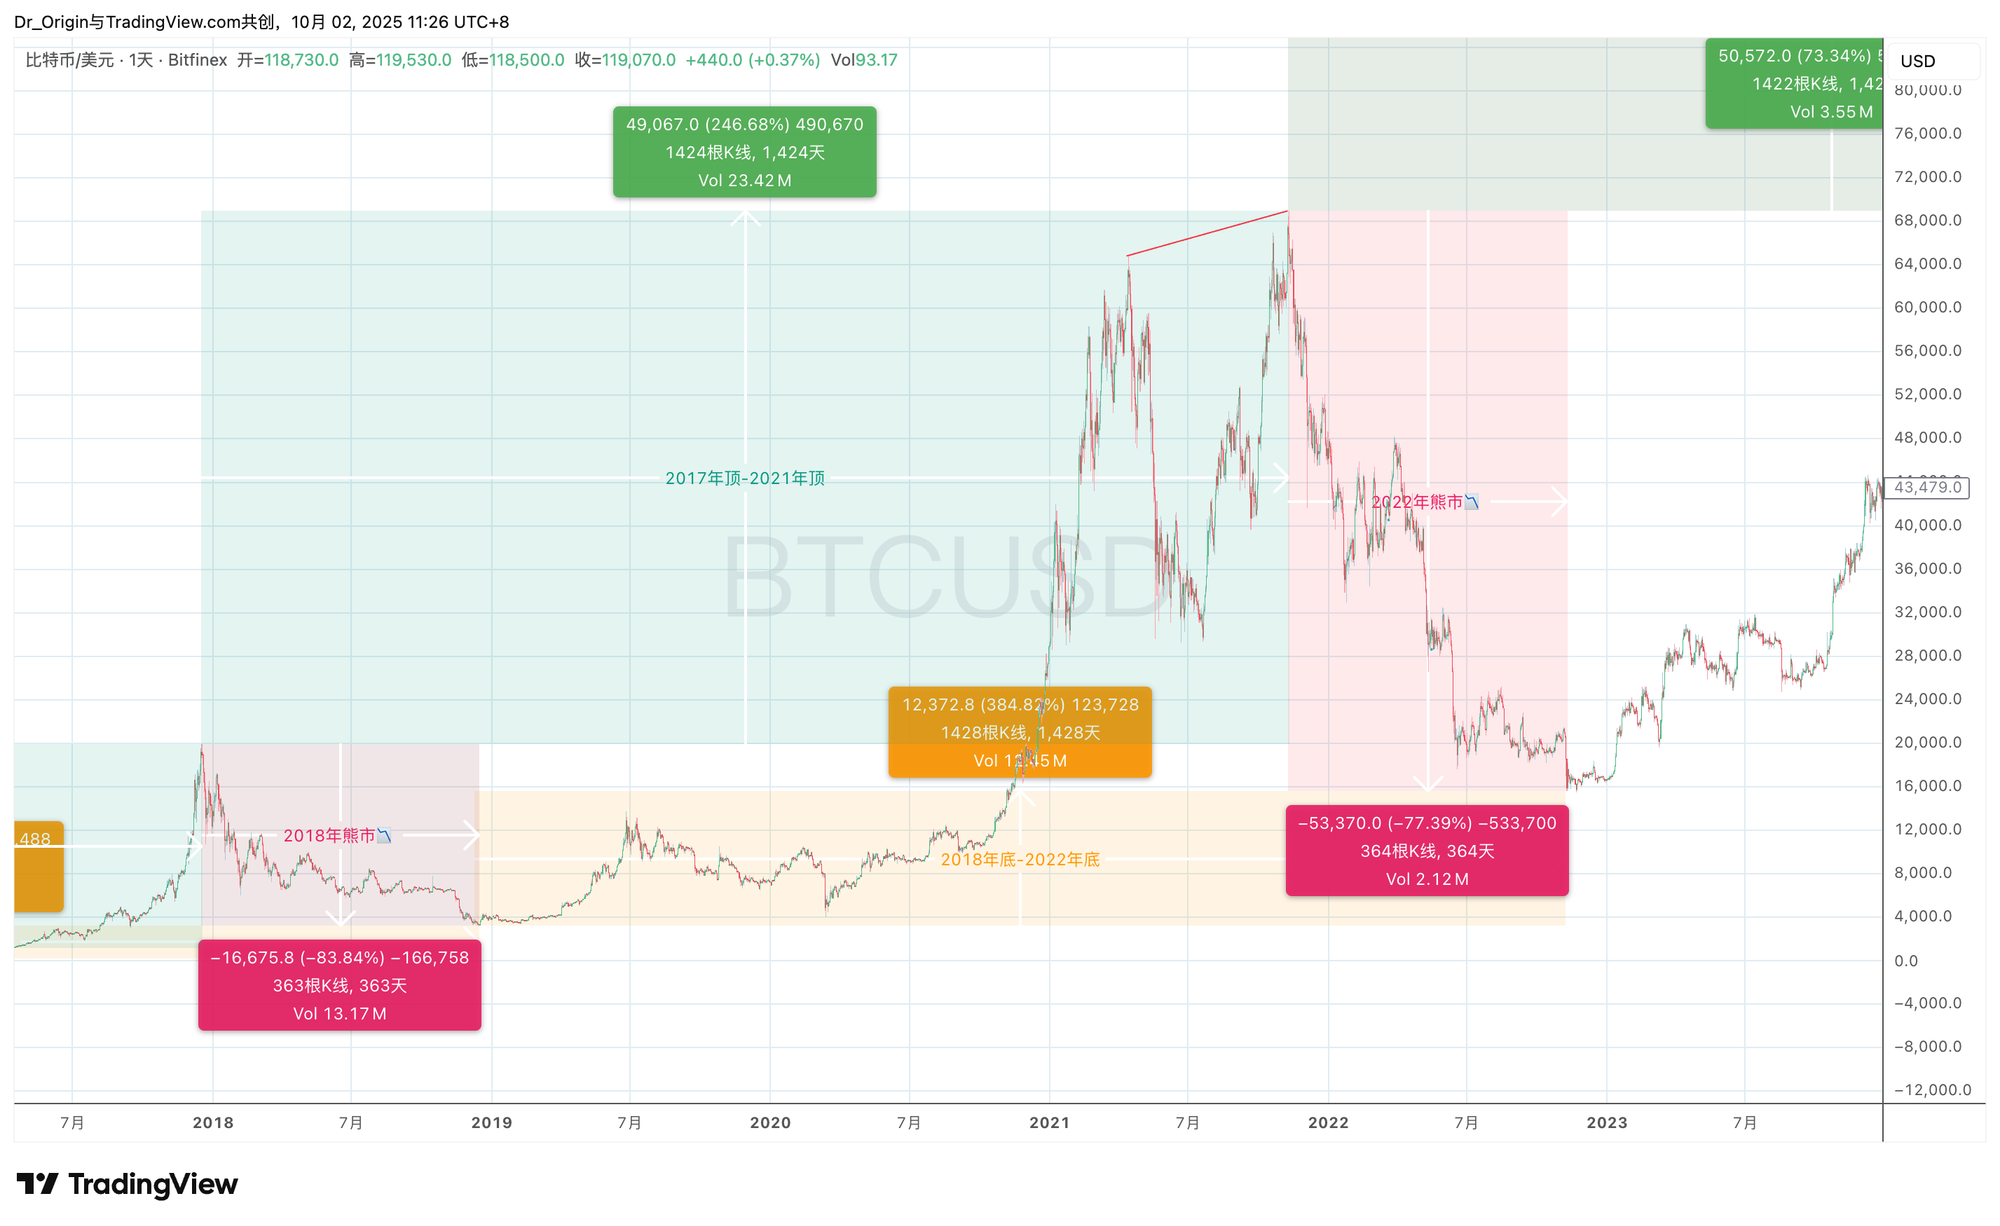

Historical charts provide us with precise cycle duration data:
● Top-to-Top Cycle: Late 2013 top to late 2017 top, 1474 days. Late 2017 top to late 2021 top, 1424 days.
● Bottom-to-Bottom Cycle: Early 2015 bottom to late 2018 bottom, 1424 days. Late 2018 bottom to late 2022 bottom, 1428 days.
This high consistency in top-to-top and bottom-to-bottom cycles demonstrates that a complete Bitcoin cycle lasts approximately 1424-1428 days. (The 1474-day cycle from 2013-2017 may be an outlier due to crypto's niche status during that phase.)
The current cycle began from the late 2022 bottom. As of this report's publication (October 2, 2025), 1422 days have passed since the 2021 top. From a temporal perspective, the market has already traversed the vast majority of a typical cycle and has entered the clearly defined "distribution phase" or "late-stage bull market" of cycle theory. This places a strong macro-temporal constraint on the formation of a major top.
This cyclicality is not a coincidence; it is a "reflexive" market phenomenon. Because a critical mass of market participants believes in and trades according to the four-year cycle (e.g., taking profits 12-18 months post-halving), their collective actions objectively reinforce the cycle's existence. The market is therefore operating under a powerful, self-fulfilling temporal constraint. Any sustained rally that deviates from this time window will face immense resistance from historical precedent.
2.2. Market Structure & Game Theory: Anatomy of a Wyckoff UTAD
The market's current price structure is the key to decoding the intent of dominant capital. The price action since mid-2025 is not a healthy consolidation for a new rally; it is the playing out of a classic Wyckoff Distribution model.
The Wyckoff Methodology Core
The theory's essence is that large institutions (the "Composite Operator" or "Smart Money") must manufacture buying liquidity to offload their holdings. The ultimate goal of a distribution phase is to quietly transfer their massive inventory to the public within a defined price range.
Historical Case Study: The 2021 Top
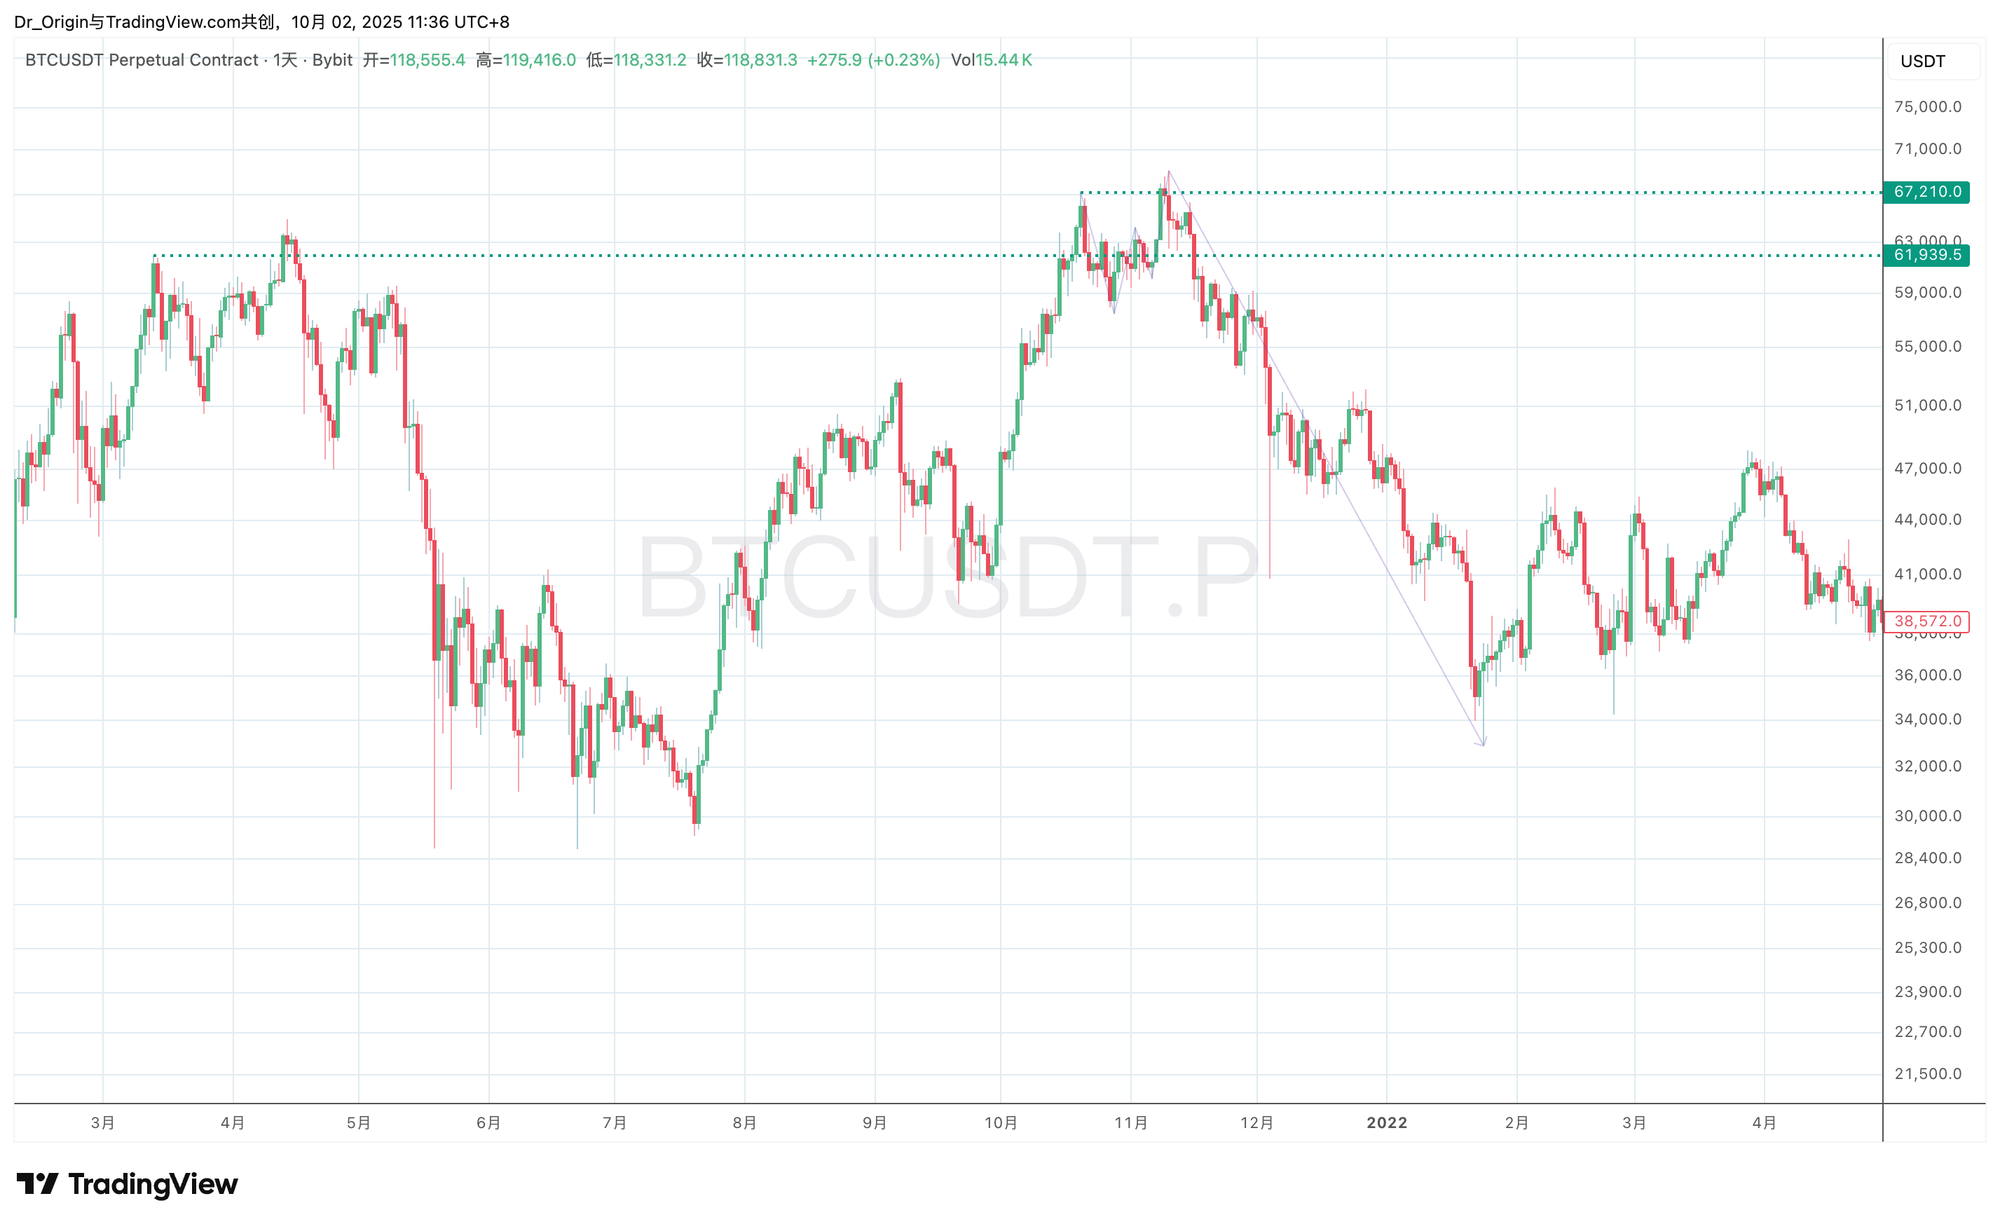
The 2021 top provides a perfect analog. The run to a new high of $69,000 in November 2021, after the initial April 2021 high, was a textbook Upthrust After Distribution (UTAD). Its purpose was not to start a new trend, but to:
1. Hunt Shorts: Trigger all stop-loss orders placed above the previous $67,210 high.
2. Induce Longs: Create the illusion of a breakout, trapping retail and momentum traders into buying the top—the "bull trap".
3. Complete Distribution: At the moment of peak market optimism and buy-side volume, execute the final and largest tranches of their sell orders.
Current Market Parallel
The market is now re-running this exact script.
From a game-theory perspective, the UTAD is the most efficient method for large players to complete their exit strategy. A slow bleed would induce panic and evaporate liquidity, making distribution exceptionally difficult. Conversely, manufacturing an exciting, new-all-time-high rally maximizes the market's willingness to buy, allowing for the largest possible volume to be sold at the highest possible price. Therefore, any break of the previous high ($124,571) must be treated as a potential, meticulously designed trap, not a signal of bull market continuation.
2.3. Trend & Momentum: The High-Timeframe Dominance Alert
Technical indicators are our stethoscope for diagnosing trend health. The most disturbing signal in the current market is the violent conflict between different timeframes. Per the fundamental principles of technical analysis, high-timeframe (HTF) signals hold absolute precedence.
The Macro Weekly Bearish Divergence
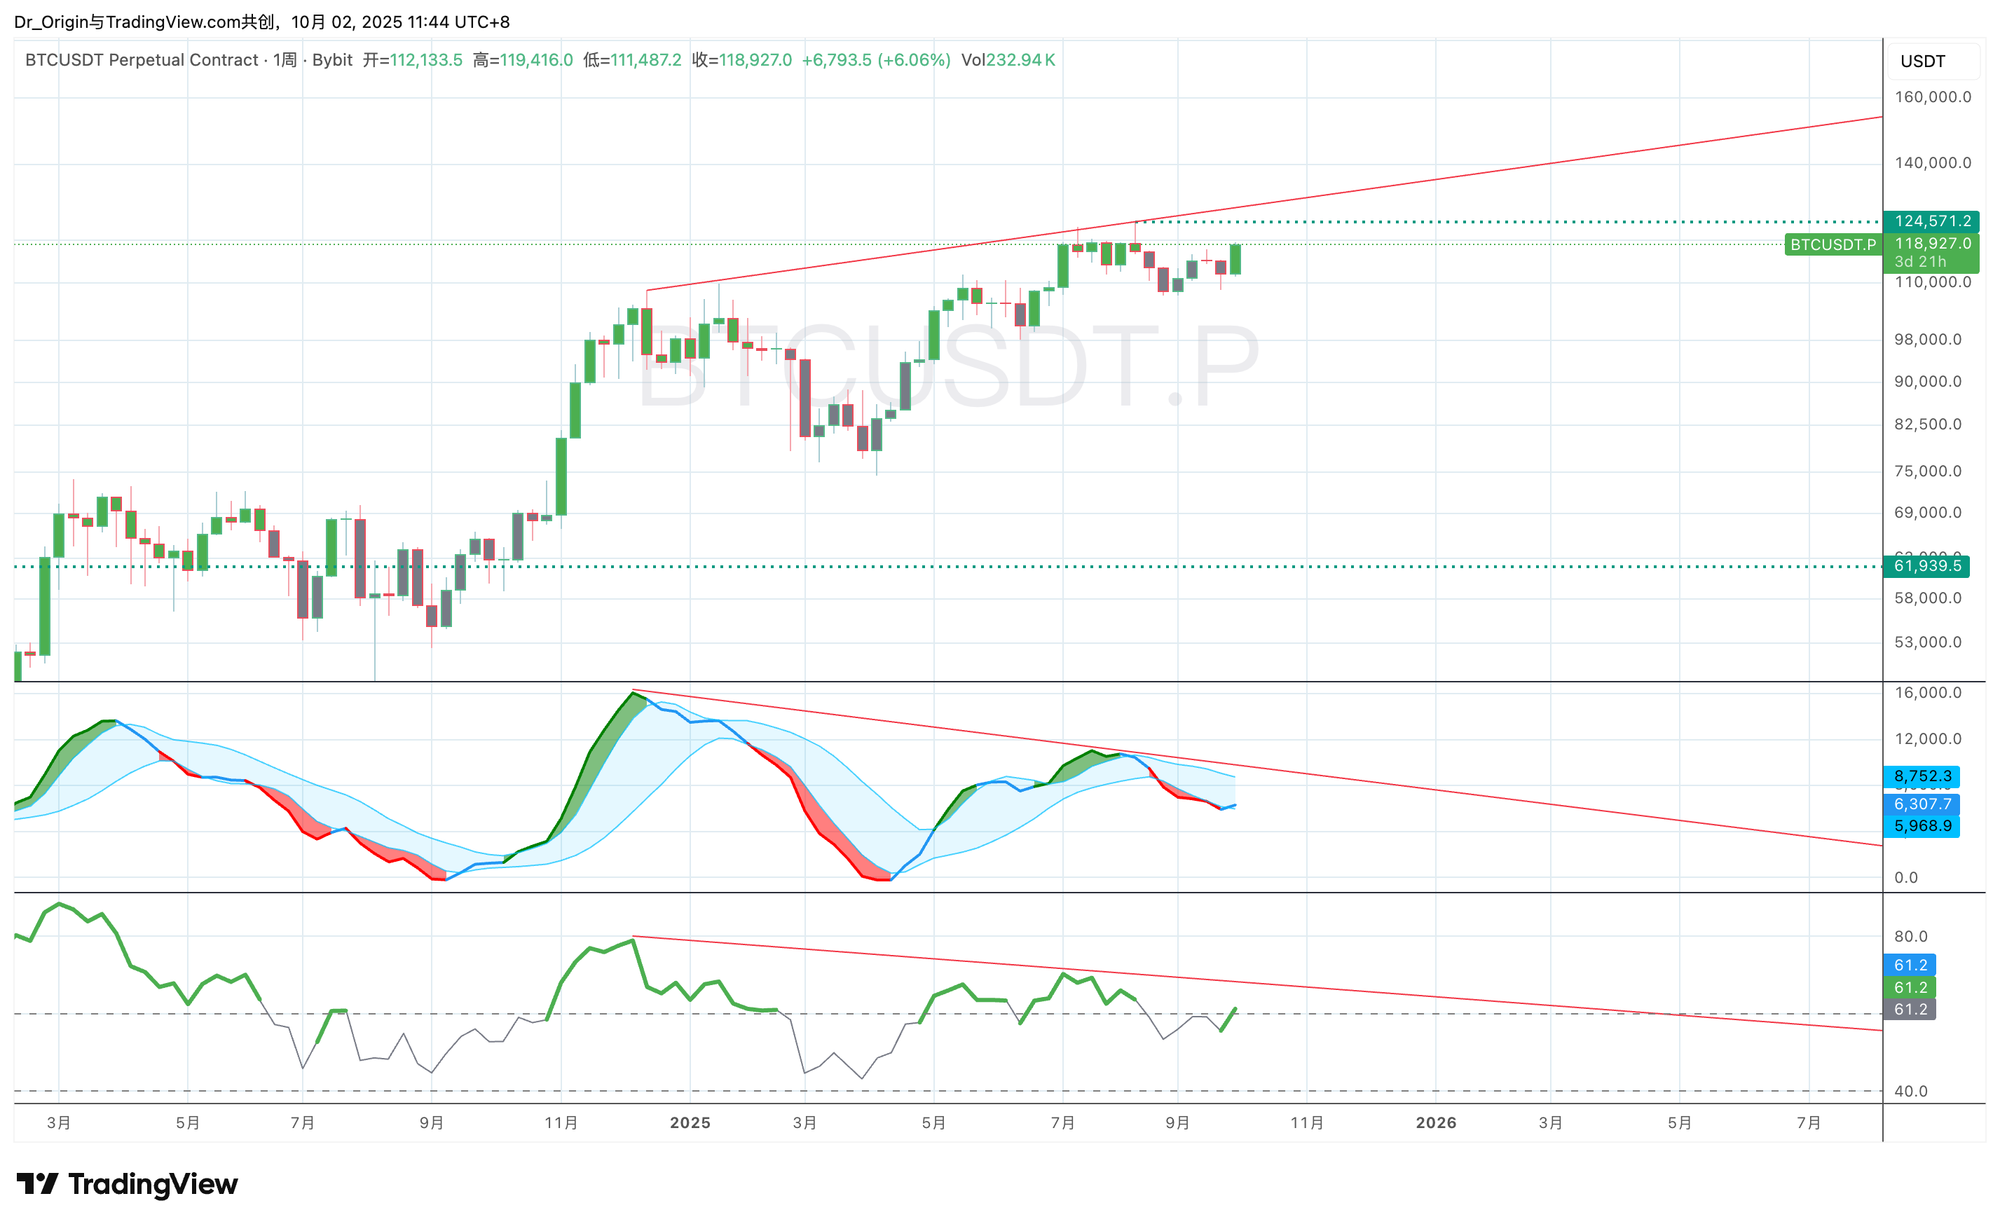
Across the weekly chart, a severe and unambiguous bearish divergence has been forming throughout 2025. Specifically:
● Price: Has made a series of "Higher Highs" during 2025.
● Momentum (MACD & RSI): In direct opposition, these indicators have printed a series of "Lower Highs".
This long-term divergence between price and momentum is one of the most potent technical signals that the internal strength of the trend is failing. It shows that each new price high is being driven by progressively weaker buying, and the market's intrinsic upside momentum is exhausted. The significance of this macro-level signal far outweighs any short-term daily or hourly noise.
Interpreting the Timeframe Conflict
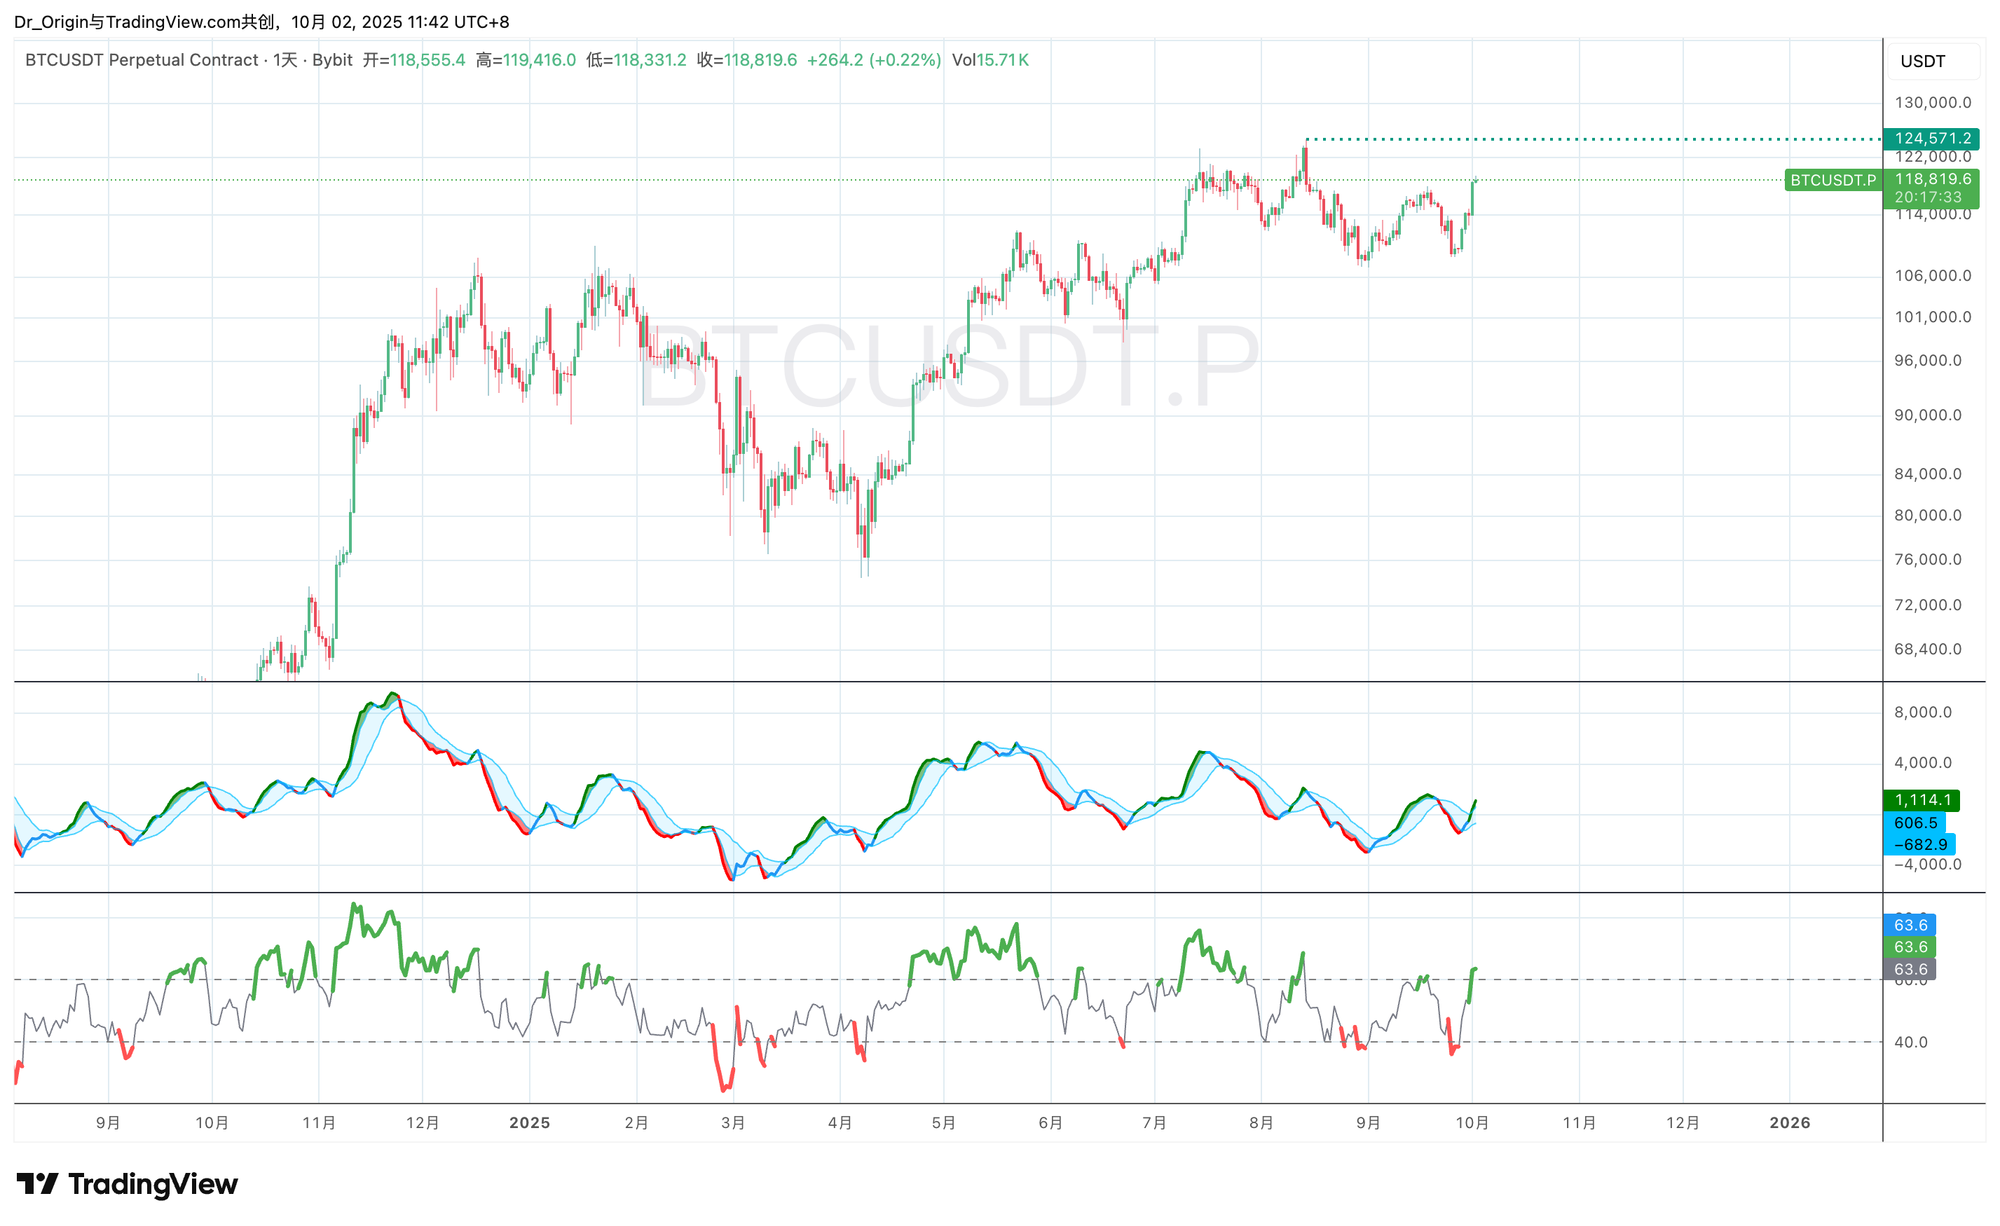
The current daily chart shows robust upside momentum, which is in sharp conflict with the weak weekly picture. We must interpret this phenomenon through the "HTF-dominates-LTF" (Low Timeframe) principle.
● Daily Strength: This should be understood as the short-term tactical momentum required to execute the UTAD liquidity hunt. It reflects the short-term sentiment manufactured by squeezed shorts and FOMO-ing longs.
● Weekly Weakness: This predicts the long-term strategic direction after the tactical mission (the UTAD) is complete. Once the liquidity hunt is over, the market, lacking new buyers, will inevitably capitulate to the direction signaled by the exhausted weekly indicators.
This conflict itself is a hallmark characteristic of a top: short-term euphoria masking long-term structural fragility.
2.4. Macroeconomics: Navigating a Contradictory Liquidity Landscape
A core component of this report's thesis is the deceptive complexity of the current macro environment. At first glance, the Fed's dovish pivot, a weak dollar, and M2 growth appear to provide a fertile ground for risk assets. However, a deeper dissection of the drivers behind these factors reveals a "low-quality" liquidity environment, insufficient to fuel a new structural bull market.
The Truth of Monetary Policy
Recent data shows the Fed has turned dovish. In September 2025, the Fed cut rates by 25 basis points, with further cuts expected. The context for this action, however, is critical. Chairman Powell explicitly defined this as a "risk management cut," directly triggered by a "weakening labor market" and "downwardly revised historical hiring data". This is not a proactive stimulus to fuel growth in a strong economy; it is a reactive measure to fend off recession risk. Concurrently, inflation remains "above target," severely constraining the Fed's ability to engage in more aggressive easing. Furthermore, the Fed's August 2025 update to its policy framework, which abandoned its commitment to "average" inflation targeting for a more "balanced," data-driven approach, has only increased its policy flexibility and uncertainty.
Structural Weakness of the Dollar Index (DXY)
The DXY experienced one of its worst performances in 50 years in the first half of 2025, falling 10.7%. Morgan Stanley predicts it could fall another 10% by the end of 2026. The drivers are a slowing US growth outlook, policy uncertainty, and global capital reallocation. While a technical bounce near the 100 level is possible, the long-term trend is down, which is typically seen as a positive for risk assets.
Global Liquidity (M2) Rebound
Global liquidity is not tightening. The US M2 money supply grew 4.8% year-over-year in July and August 2025, reaching $22.2 trillion, its fastest growth rate in three years.
Synthesis: The Liquidity Paradox
The market is facing a "liquidity paradox". Nominal liquidity metrics (rate cuts, weak DXY, M2 growth) appear bullish, but the quality of this liquidity is extremely low. It is being injected reactively to combat economic weakness, not proactively to stimulate a healthy economy. This "restorative" liquidity can spark brief, sentiment-driven rallies in risk assets, but it lacks the solid economic fundamentals required to power a multi-year, structural bull market.
Bitcoin's current fragile internal structure (see subsequent sections) makes it unable to effectively absorb this low-quality liquidity and convert it into a new parabolic advance. The macro environment is therefore a "red herring"—it provides the perfect cover and just enough fuel to build the UTAD trap, but it is wholly insufficient to sustain a true bull run.
2.5. On-Chain Forensics: The Footprints of Smart Money’s Exit
On-chain data is our X-ray, allowing us to see past the market's price skin and observe the network's internal health. Current metrics paint a clear picture of "Smart Money" distributing to "Dumb Money" (i.e., late and new demand).
LTH-SOPR (Long-Term Holder Spent Output Profit Ratio)
This metric specifically tracks whether "Long-Term Holders" (LTHs), addresses holding Bitcoin for over 155 days, are selling at a profit or loss. Data shows that LTH-SOPR has remained consistently above 1 since 2024, indicating this cohort has been steadily selling in profit. Recent data confirms LTHs have realized profits on 3.4 million BTC, a scale comparable to previous cycle tops. Most critically, the LTH-SOPR peak has failed to make a new high along with price, forming an "on-chain divergence." This demonstrates that at higher prices, the market's demand is weakening in its ability to absorb this "Smart Money" sell pressure.
Exchange Flows
Since the rally began on September 29, Bitcoin inflows to exchanges have consistently outpaced outflows, with a net inflow of 75,000 BTC. This is one of the most direct pieces of evidence for distribution, as investors transfer coins to exchanges primarily to sell.
Composite Interpretation
The on-chain data reveals a clear behavioral divergence: "old, smart money" (LTHs) is using this rally to distribute and lock in profits at scale, while "new, late money" (Short-Term Holders) is absorbing this supply at the highs. This is a classic wealth transfer mechanism and the hallmark micro-structure of a market top.
2.6. Derivatives Market: From Rocket Fuel to Liquidation Time Bomb
The core driver of this rally has been the derivatives market. However, its internal dynamics have fundamentally shifted. The market has evolved from an environment primed for a "short squeeze" to a high-risk structure vulnerable to a "long squeeze" and a mass liquidation cascade.
Open Interest (OI)
Total Open Interest in Bitcoin perpetual contracts is once again approaching its all-time high. This historic high indicates a massive amount of leveraged positions have accumulated in the market. Such enormous OI is not inherently bullish or bearish, but it represents a massive store of "potential energy".
The "Phase Shift" in Risk
The market has undergone a "phase shift" in its risk profile:
● Pre-Rally: Risk was asymmetrically skewed to the upside. Crowded shorts and low funding costs meant any price spike could trigger stop-losses, creating a "short squeeze" positive feedback loop.
● Post-Rally: Risk is now asymmetrically skewed to the downside. Extremely high OI means the market is saturated with leveraged longs. Now, any meaningful price dip will trigger their stop-losses and forced liquidations. One liquidation will press the price lower, triggering more liquidations at lower levels, creating a devastating "long-squeeze" cascade.
The derivatives market has transformed from the "fuel" for the rally into the "gunpowder" for a potential collapse. Market stability is now inversely proportional to the scale of Open Interest. Any significant spot-side selling pressure will be dramatically amplified by this leverage.
2.7. Cross-Asset Correlation: An Isolated Rally Lacking Confirmation
A healthy, sustainable bull market typically exhibits broad market participation and healthy rotation between sectors. This Bitcoin rally, however, appears isolated and unhealthy, lacking confirmation from other key assets and exposing new systemic risks.
High Correlation to the Nasdaq Index
Recently, Bitcoin's 30-day correlation to the Nasdaq 100 index has spiked to a high of 70%. This high correlation, once viewed as a positive sign of "institutional adoption," has now morphed into a significant risk exposure. It means Bitcoin is no longer functioning as an independent, non-correlated "safe haven" or "store of value" asset, but rather as a high-beta "tech stock".
This role change is fatal. It tethers Bitcoin's fate directly to the macroeconomic risks of the traditional financial markets. As analyzed in section 2.4, the US economy is showing signs of weakness, placing the Nasdaq itself in a vulnerable position. This high correlation is therefore a trap, tethering Bitcoin to a traditional market "anchor" that may be about to sink. Any traditional equity sell-off, triggered by deteriorating macro data, could directly, via this correlation, trigger a synchronous crash in Bitcoin.
Part 3: Synthesis & Strategic Action Plan
3.1. The Convergence of Evidence
Synthesizing the analysis from all seven dimensions, we have constructed a complete and highly confluent chain of evidence pointing to a major market top. All signals are aligned, pointing to one conclusion: The market is in a structurally fragile topping zone, and its current strength is a façade, engineered for final distribution.
1. Time (Dim 1): We are in the cyclical topping window.
2. Structure (Dim 2): We are witnessing a textbook final liquidity hunt (UTAD).
3. Technical (Dim 3): Long-term momentum exhaustion (weekly divergence) signals an impending trend reversal.
4. Macro (Dim 4): The seemingly favorable liquidity is "low-quality" and driven by economic weakness.
5. On-Chain (Dim 5): The data reveals "Smart Money" is in full distribution, while new demand is failing.
6. Derivatives (Dim 6): The market has morphed from a squeeze engine into a systemic liquidation risk.
7. Correlation (Dim 7): The rally is isolated and exposed, dangerously tethered to a vulnerable traditional market.
These seven dimensions are mutually reinforcing, creating a closed logical loop that dramatically increases our confidence in the core thesis of an imminent market top.
3.2. Probabilistic Scenarios
High-Probability Scenario (>70%): UTAD Completion & Trend Reversal
The market will complete its final "UTAD" phase. Price will push higher, briefly breaking the previous high of $124,571 to set the ultimate cycle top in the $125,000 - $130,000 range. This breakout will be accompanied by a surge in volume and extreme euphoric sentiment. However, the price will fail to hold above this level, followed by a swift and violent reversal, with a daily close back below $124,571. This will be the key confirmation signal that the top is in, initiating a weekly-level, long-term downtrend.
Low-Probability Scenario (<30%): Structural Breakout & Thesis Invalidation
The market defies all bearish signals as extremely strong spot buying absorbs all distribution. Price not only breaks $130,000 but holds above it (e.g., multiple weekly closes above this level). In this scenario, the weekly bearish divergence would be nullified, signaling a new, powerful fundamental factor has entered the market and completely altered its structure. We would then concede the thesis is wrong and re-evaluate.
3.3. Tactical Short Position Playbook
Based on the high-probability scenario, we have formulated the following detailed "Sell-The-Rally" tactical plan. The core principle is patience: We do not predict the top; we trade the confirmation of the top.
