
The Q1 2026 Bitcoin landscape is defined by extreme geopolitical turbulence, homogenized algorithmic trading, and systematic liquidity raids by institutional capital. This environment has constructed an exceptionally complex asset pricing matrix. Following a clear structural breakdown over the past week, Bitcoin initiated a sharp, localized relief rally. This volatility serves as a definitive sample for deconstructing the market’s underlying micro-mechanisms.
While mainstream financial media and retail participants attributed the March 23rd rebound to political headlines regarding conflict de-escalation, our conclusion is fundamentally different. Asset pricing is perpetually constrained by internal liquidity; geopolitical news merely serves as a momentum catalyst to amplify pre-set volatility rather than creating the trend direction.
I. Validating the Narrative: From Structural Collapse to the Precision Rebound
Our ability to capture market trajectories stems from calculating liquidity imbalances rather than predicting the unpredictable behavior of politicians.
1.1 The 48-Hour Crash Warning and Wyckoff Distribution
On March 16, Bitcoin printed a rare streak of seven consecutive daily green candles, breaching the $74,000 handle. While this move triggered retail FOMO and path dependency for a "moon mission," Prism Insights identified this not as a new bull leg, but as a sophisticated institutional liquidity hunt.
We issued a definitive strategic judgment: the market was locked in a highly structured, small-scale Wyckoff Distribution. We predicted a violent collapse within 48 hours as trend-following breakout strategies became the primary target. The market followed our script with surgical precision—upside momentum evaporated against a wall of hidden limit sell orders, triggering a stop cascade and a rapid break of short-term support.
1.2 The March 22nd Bottom Forecast
Following the deep flush, sentiment shifted to extreme fear. On Saturday, March 22nd, as retail late-comers began panic-shorting, we released our internal projection to our Platinum and Diamond members.
Using Fibonacci clusters, we projected a hunt for sell-side liquidity at the 0.886 retracement ($66,774.0), followed by a violent reversal toward the 0.382 target ($70,325.2), with a potential extension to $71,231.
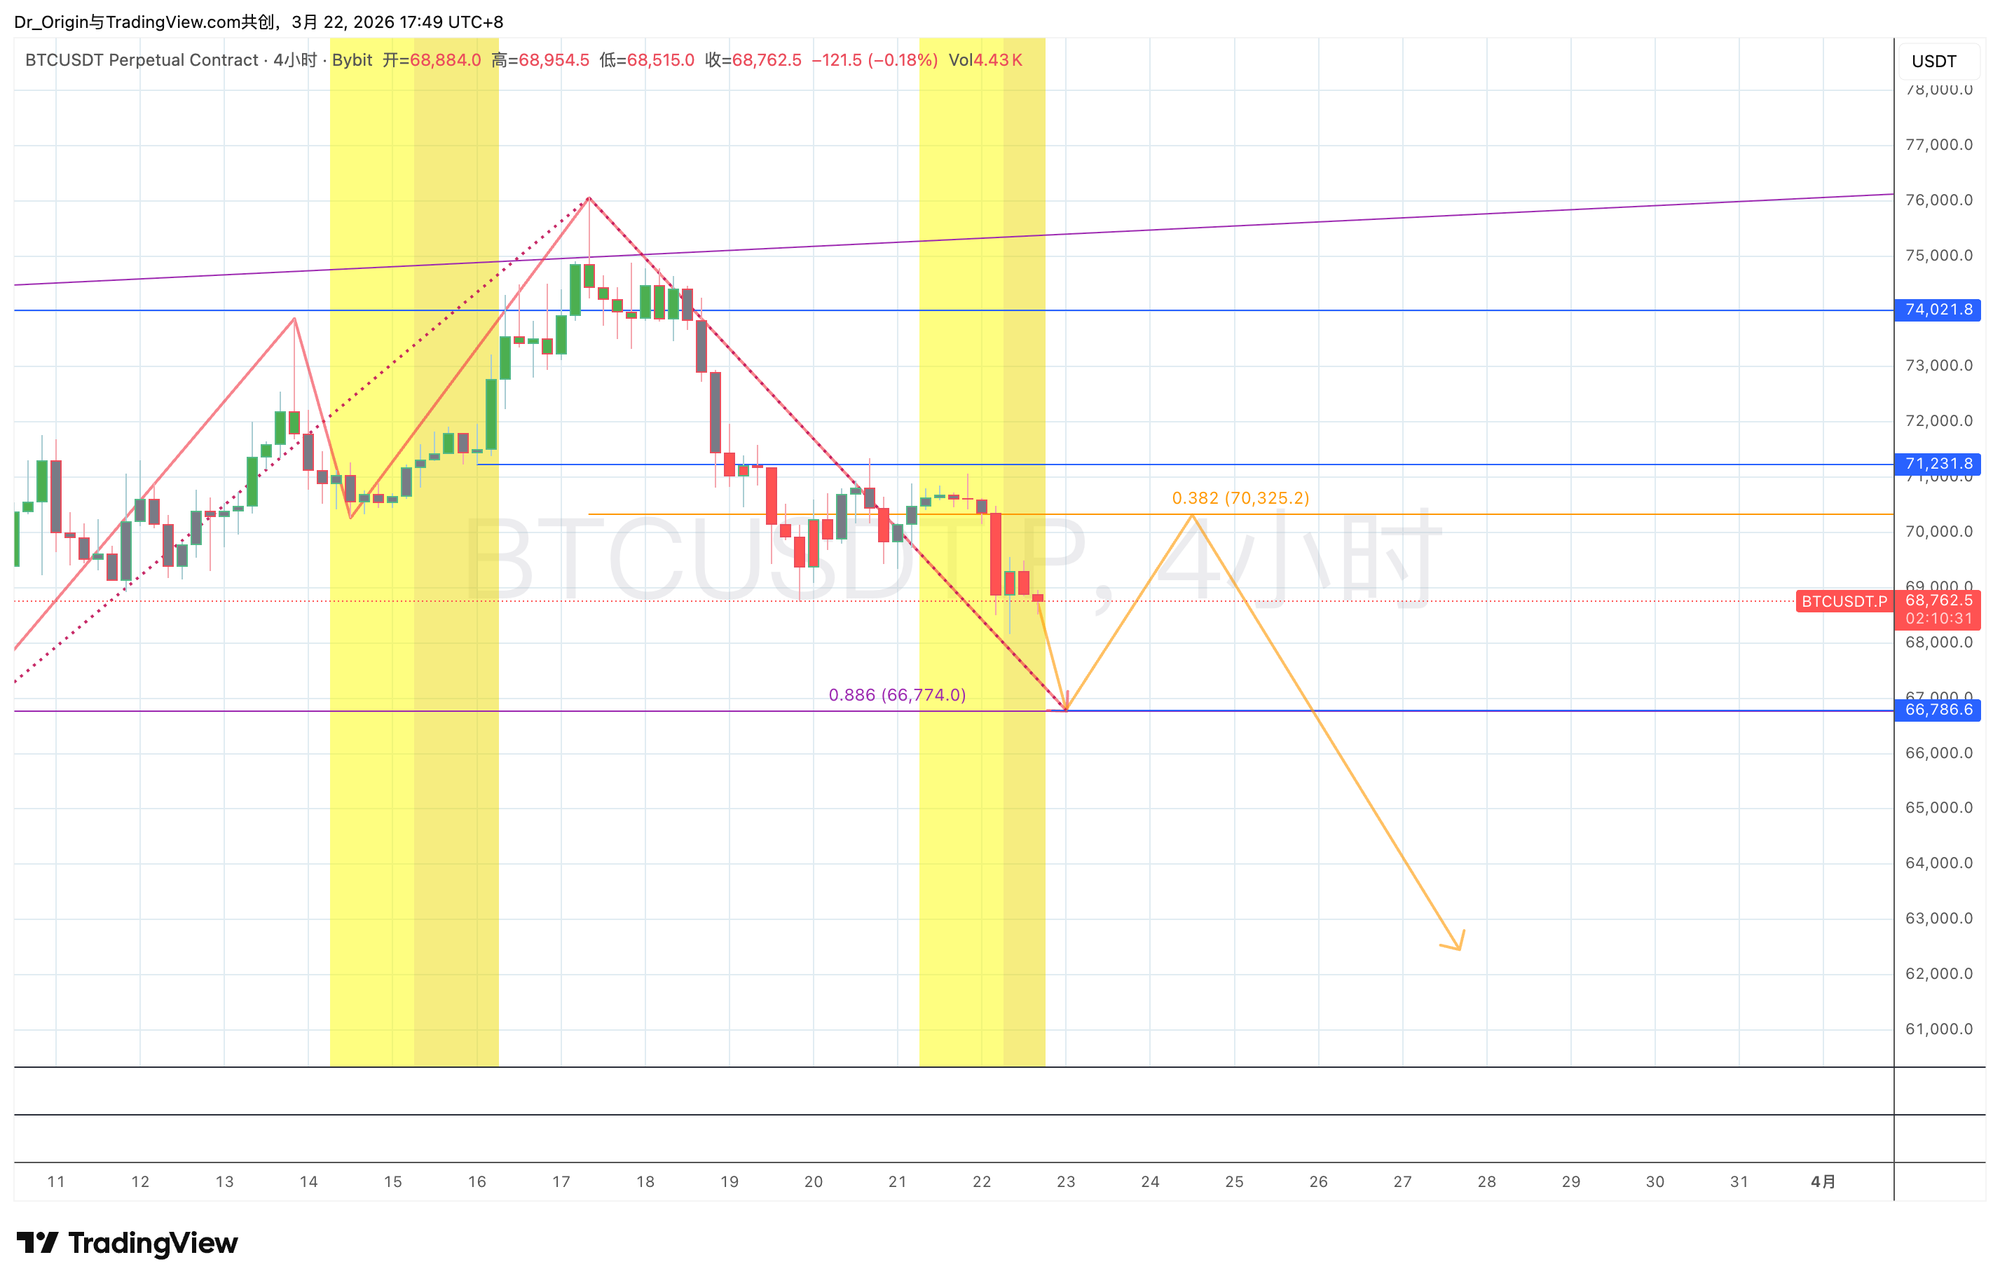
Market Realization: * The Low: Bitcoin swept liquidity at $67,300 during Monday’s Asia session.
- The Rally: Price surged through the $70,000 handle to a high of $71,170, perfectly validating a forecast published two days prior to the "news".
II. Deconstructing the TACO Effect: Narrative vs. Reality
The mainstream "TACO" (Trump Always Chickens Out) narrative—referring to the pattern of de-escalating after extreme threats—ignited algorithmic buying on Monday. However, the real driver was the Gravity of Liquidity Pools.
As price fell into the $67,000 range, retail momentum shorts placed dense stop-market buy orders above resistance levels. For institutional desk-drivers, these stops represent the most attractive target. They required only a catalyst—the de-escalation news—to ignite the sentiment needed to hunt these positions at a minimal cost. Even without the geopolitical headline, the market would have manufactured a similar hunt under the cover of other "news" or technical oversold signals.
III. The Path Ahead: Strategic Projections
Bitcoin is currently oscillating between $70,000 and $71,000. In the macro timeframe, this is a textbook Downside Continuation (Bearish Pennant) or a redistribution phase.
Phase 1: The High-Level Hover (Current)
We anticipate price to linger in the $70,000 - $71,500 zone. This serves two tactical purposes:
- Anchor Bias: Creating the illusion of a "proven floor" to lure sidelined capital into longing at a higher cost basis.
- Short Liquidity Accumulation: Allowing new intraday shorts to build up, providing "fuel" for the next institutional move.
Phase 2: The Final Liquidity Sweep (High Probability)
Before a return to the macro downtrend, we expect a "Fakeout Pump". This move will likely pierce the $72,000 level to sweep the final buy-stops and trigger FOMO among the last remaining rational bears.
Phase 3: The Capitulation toward $60,000
Once upside liquidity is exhausted and retail is trapped at the highs, the market will lose all upward momentum. As geopolitical risk premiums re-assert themselves and rate-cut expectations remain delayed, the supply of capital will be severed. Having completed their stealth distribution, institutions will pull the bid, leading to a "free-fall" test of the $60,000 handle and below.
IV. Prism Insights: Trading Discipline
The essence of trading is the precision identification of micro-structures, not a laggard reaction to macro headlines. In a zero-sum (or negative-sum) market, every "explosive breakout" often masks a massive institutional distribution order.
At this juncture, with crowded trades and fragile exchange liquidity, blind optimism is a liability. Prism Insights remains committed to a rigorous logical loop and iron discipline—the only way to navigate the cycle and secure long-term Alpha.
Disclaimer: This report reflects the judgment of the Prism Insights team and is for informational purposes only. Cryptocurrency markets involve extreme risk and leverage. This is not direct investment advice.