
1. Why We Are Decisively Bearish
As of January 27, 2026, both bulls and bears are experiencing an unusual kind of market exhaustion.
Bitcoin briefly broke below its prior low over the weekend, only to reclaim it shortly after. Some interpreted this as a false breakdown. Others saw it as trend confirmation. Market sentiment now oscillates between “a healthy bull-market pullback” and “the start of a new bear market.”
Prism Insights takes a clear stance:
Bitcoin is not building a base. What we are witnessing is a deliberate, textbook institutional distribution phase.
Whenever the market creates the illusion that “price can’t fall anymore,” risk is usually at its highest. The current structure shows striking fractal similarity to the price action seen in April 2022, just before the LUNA collapse. This is not a coincidence of candlesticks — it is a replay of the same underlying liquidity mechanics.
Our core thesis is blunt, and uncomfortable for longs:
This consolidation is the final floor before an “elevator-style” decline.
Large players are exploiting retail and late institutional dip-buying psychology, engineering rebound illusions inside a range while conducting a final liquidity hunt and position transfer.
We will outline why we are aggressively bearish through four lenses:
- Historical structure comparison
- Wyckoff distribution
- Moving-average death crosses
- The hidden downside spiral risk embedded in ENA / USDe
2. Market Structure Review: A 2022 Replay
Markets do not repeat mechanically, but they rhyme. Fear, greed, and leverage cycles never change.
Overlaying BTC in April 2022 with BTC in January 2026 reveals an unsettling degree of structural similarity.
2.1 Microstructure Candlestick Comparison
Current BTC price action is not random chart-drawing. It sits inside a highly structured Wyckoff distribution pattern. To understand where we are, we must revisit the 2022 pre-crash structure.
2.1.1 The 2022 Bull Trap
After topping at $69,000 in late 2021, Bitcoin entered months of choppy, downward consolidation.
Between late March and early April 2022, BTC staged a powerful but deceptive rebound. Price briefly reclaimed $48,000, and the market narrative flipped aggressively bullish. “Double bottom.” “Bull market resumption.” Optimism was widespread.
From an institutional perspective, this was a classic LPSY (Last Point of Supply).
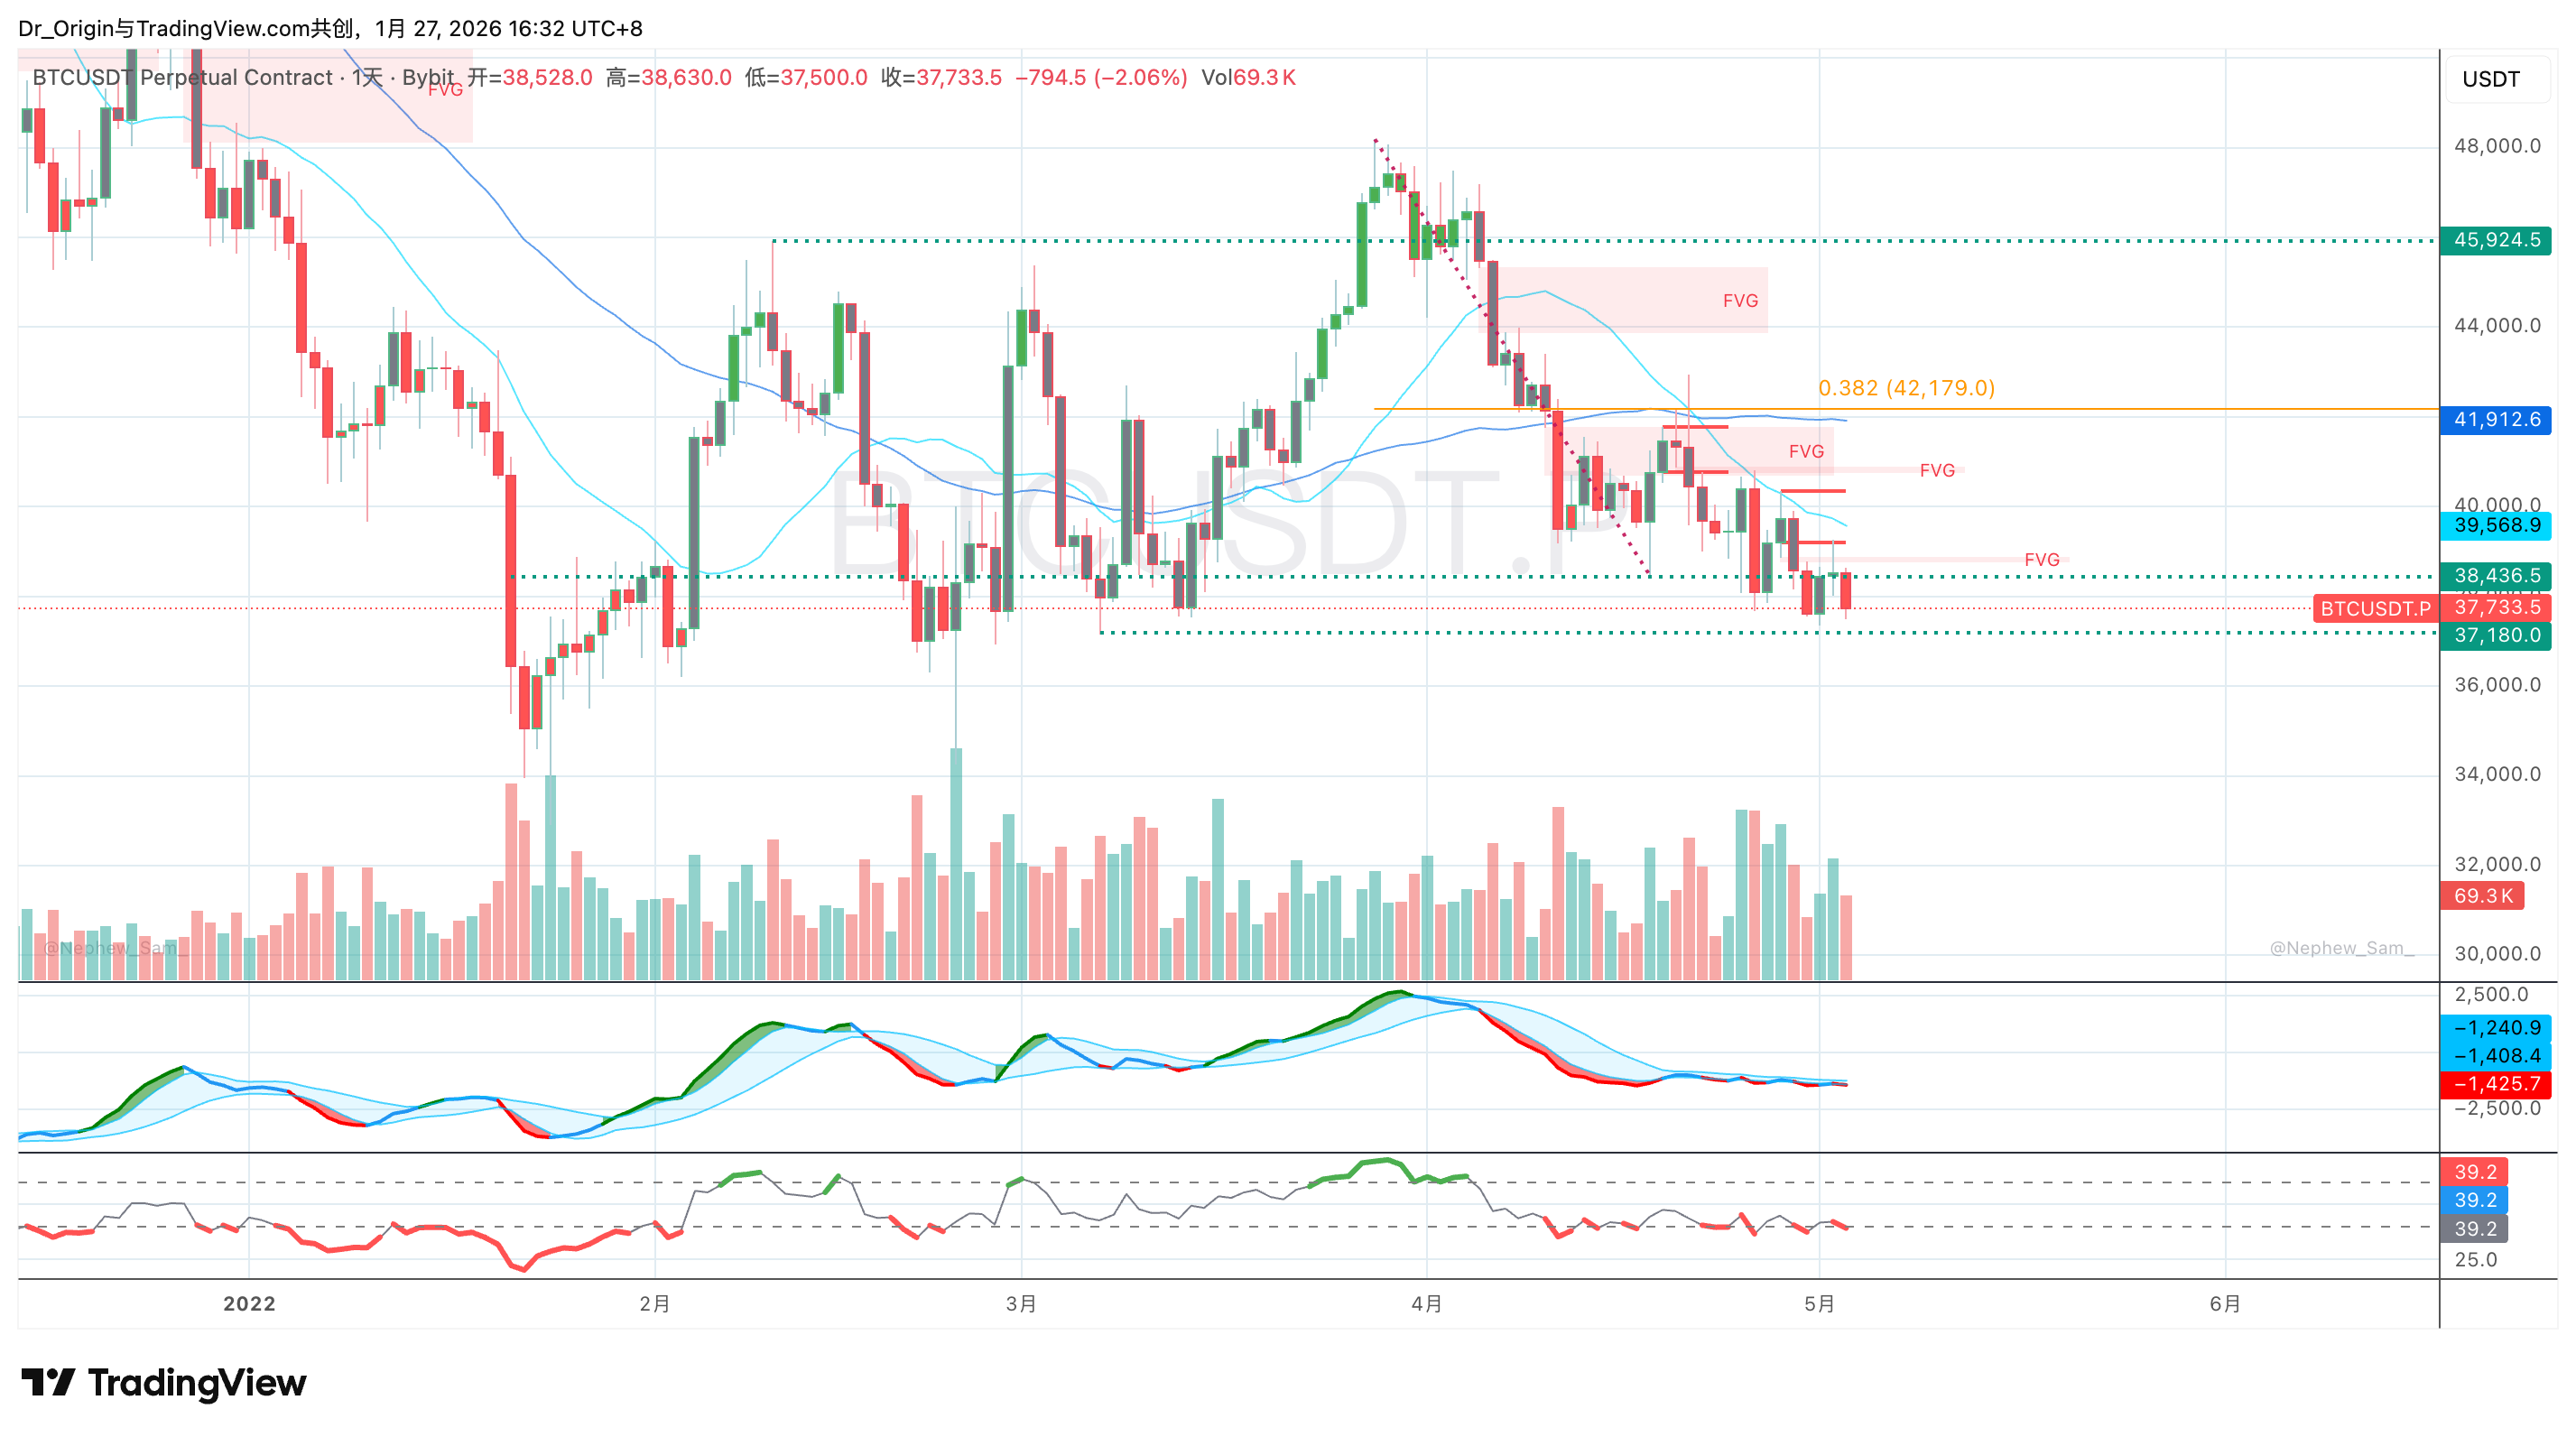
Large players did not accumulate. They used the rebound to exit longs and establish shorts, feeding on the liquidity provided by optimistic buyers. Once price broke below the $37,000 consolidation zone, a stop cascade followed, culminating in the Terra collapse and a BTC low near $17,000.
2.1.2 The 2026 Mirror
Fast-forward to January 2026.
Bitcoin was rejected near $98,000 and now oscillates between $88,000–$90,000 — structurally identical to the $39,000–$42,000 range in 2022.
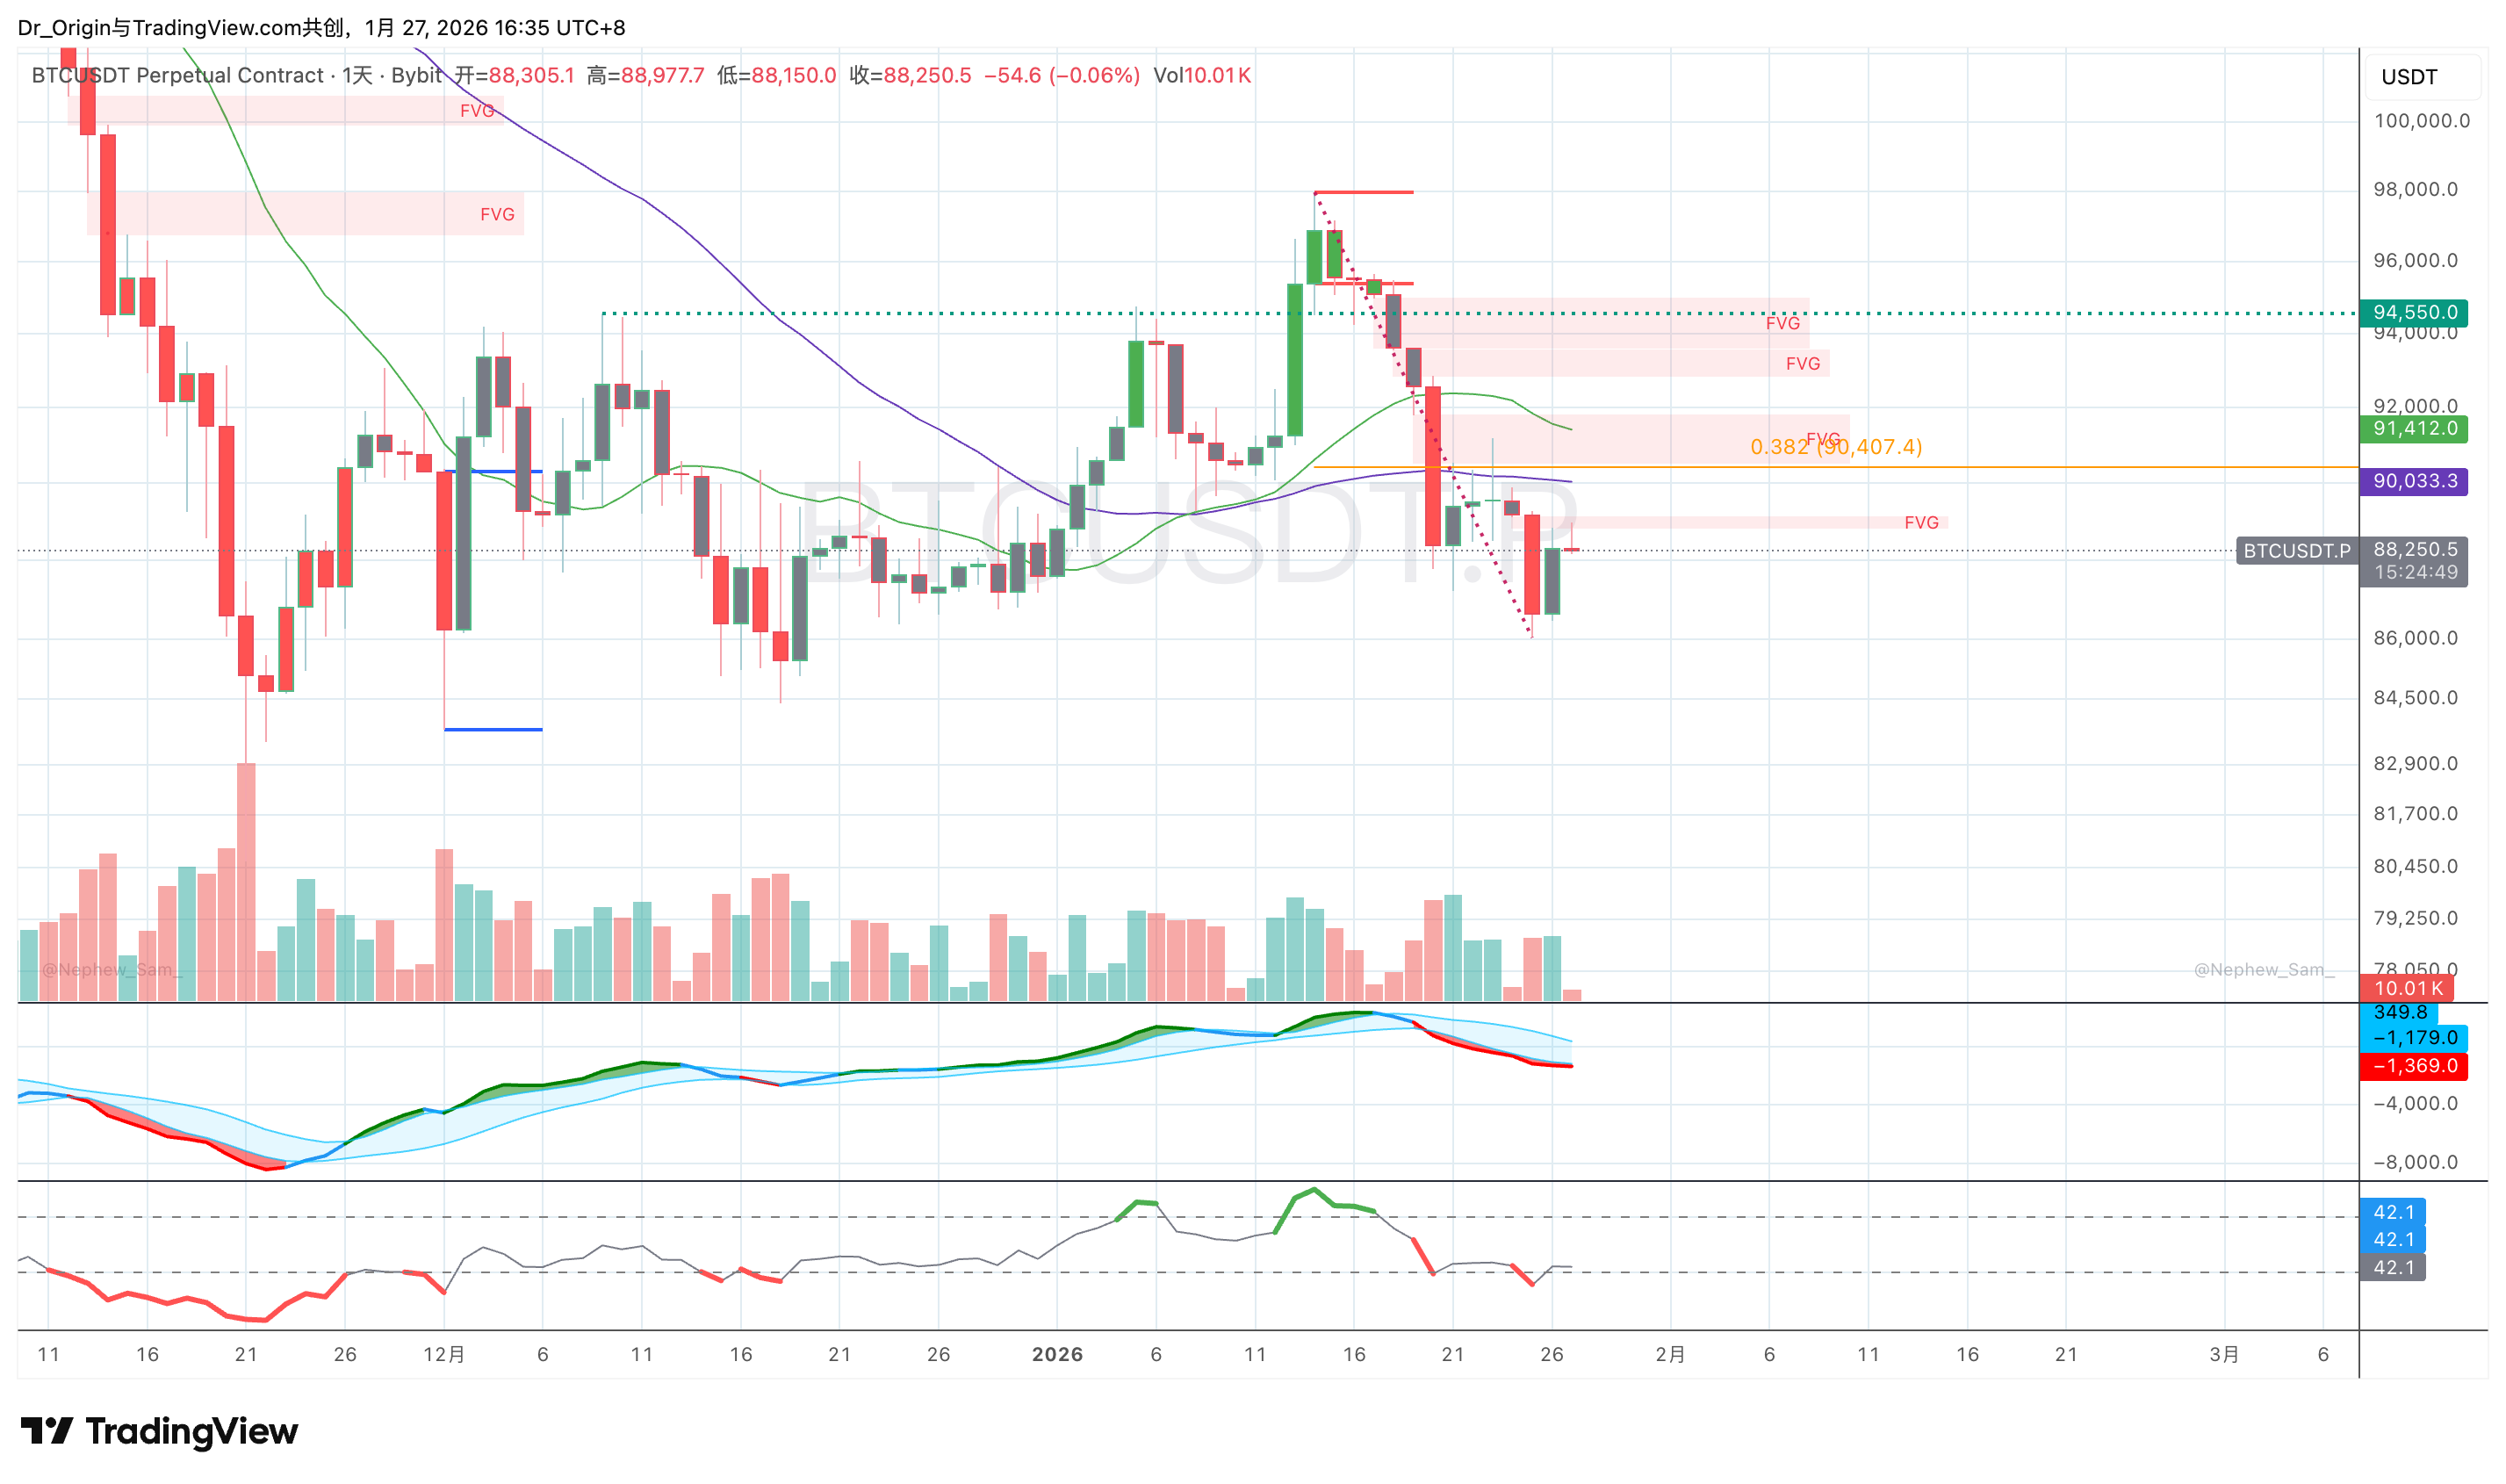
Key parallels:
- Lower highs:Each rebound fails below the prior peak, signaling systematic absorption of buying pressure via limit sell orders.
- Fragile support:The $86,000–$88,000 zone mirrors the 2022 $39,000 support. Retail often interprets repeated tests as strength. Institutions understand support is like ice — the more it’s tested, the more likely it collapses.
- Weak FVG retraces:Each attempt to reclaim short-term moving averages or fill upside FVGs is shallow and lethargic. These moves are not reversals — they are liquidity repairs.
2.2 Wyckoff Distribution
Under Wyckoff theory, Bitcoin is entering the prelude to Phase D.
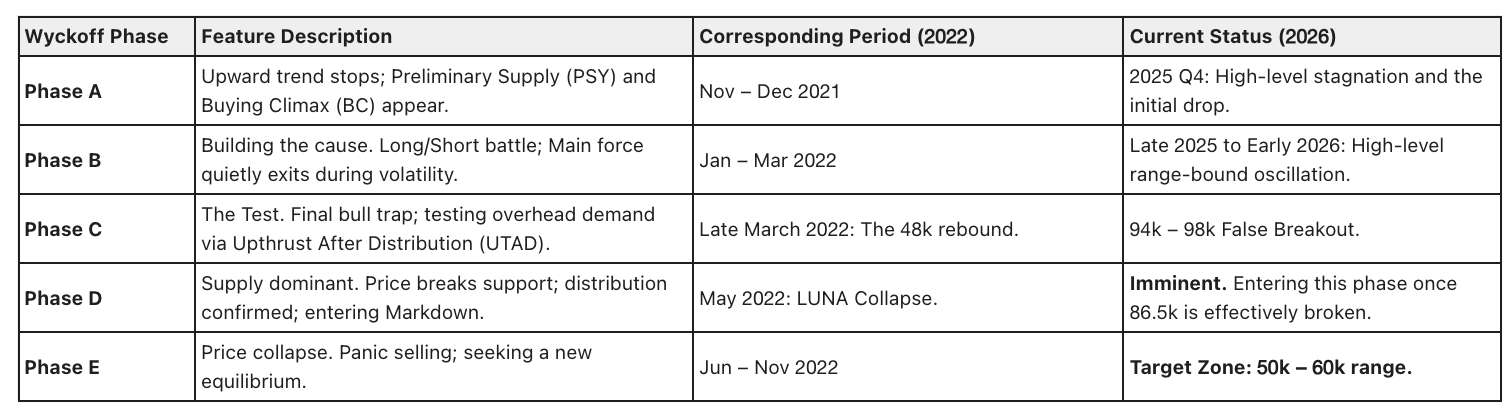
Smart money is deliberately creating the appearance of absorption while quietly distributing remaining high-cost inventory to participants still anchored to supercycle narratives.
Such breakdowns are rarely obvious. They are often preceded by:
- macro “good news,” or
- the belief that “all bad news is priced in.”
This is precisely how mass complacency forms before acceleration lower.
3. Technical Confirmation: Death Crosses in Motion
For trend traders, moving averages remain one of the simplest and most effective structural indicators.
When short-term cost falls below long-term cost, the market enters a regime where holding becomes progressively painful — and supply increases over time.
3.1 Death Cross Signals
- Weekly MA50 has crossed below MA200 — a confirmed structural bear signal
- Daily MA50 is about to cross below MA200
High-value alpha content follows. Distribution restricted to core Prism Insights members to prevent signal crowding.